- Joined
- 19 August 2021
- Posts
- 249
- Reactions
- 736
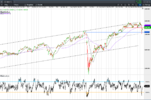
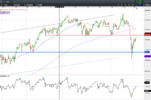
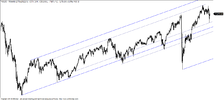
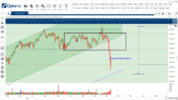
Here's a bit of 'What If" for the Wyckoff fans. What if price of the XAO bounces from its present level back up into the rectangle on the chart below. What if it then fell back a little and retested the lower boundary of the rectangle and then moved up again. To me that looks like a Wyckoff pattern which should then be saying that generally higher weekly peaks and troughs were likely for a time. Until the pattern shows its last level of support before breaking up out of the pattern, a target can't be calculated. However, if we assume prices rally strongly in that latter phase of the pattern and LLS is around 7700 then a target of around 9000 could be on the cards. Just an interesting theory.
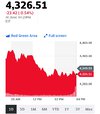
PS: US S&P is down again and while our futures are bright green - I'm not sure I believe them. A market on the slide, Putin saddling up in the Baltic, and a Friday here - I suspect a few more traders are going to want to minimise their exposure over the weekend and any rally on the open will fade away. On a positive note, the shape of the US charts suggest the slide is slowing.
PS: US S&P is down again and while our futures are bright green - I'm not sure I believe them. A market on the slide, Putin saddling up in the Baltic, and a Friday here - I suspect a few more traders are going to want to minimise their exposure over the weekend and any rally on the open will fade away. On a positive note, the shape of the US charts suggest the slide is slowing.


