Australian (ASX) Stock Market Forum

what chance somebody has tricked the ETF computers into buying ( either forcing rebalances or triggering the algos )

sadly my normal source of data is on holidays so i can't spot whether it was targeted buying on a thin market ( like the US PPG team were doing with the FAANG stocks in 2020) or genuine investor buying ( thinking anywhere but cash )

was completely surprised by the strength of today's rally i was expecting a very much milder up

i also noted REITs held up well when i thought they might trend lower this week
So are you suggesting that prices will move down from this latest high?
 
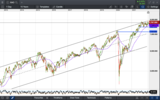
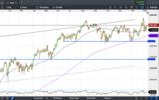
XAO still following a very bullish trend around the long term upper limits. Bit of resistance here at 7800, you'd expect. While money continues to be pumped in and interest rates remain effectively -5%, this may continue. But, the can, can only be kicked for so long. Can the Feds pull off a miracle and reduce bond buying and increase rates to stop inflation, or?

On the upside, the channel is still being respected, generally. Downside, short and medium term support shown.

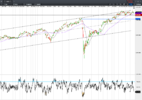
(edit: adding the longer term chart for some perspective on why I think those support lines might be tested.)

(edit 2: the chart could go parabolic too.)

(edit 3: breaking 8000 still keeps this in the longer term trend.)

Screen Shot 2022-01-13 at 5.34.36 pm.png

Screen Shot 2022-01-13 at 5.50.54 pm.png
 
Last edited:
what chance somebody has tricked the ETF computers into buying ( either forcing rebalances or triggering the algos )

Huh?

The biggest ETFs that I assume you are referring to track market cap weighted indices like XJO or whatever. They can't be "tricked" into buying, the fund manager only needs to buy when new money comes in, just as they only need to sell for redemptions.
 
So are you suggesting that prices will move down from this latest high?
artificially up or down ,

now in commodities that can be done by spoofing the futures ( totally illegal and even punished sometimes )

but something i haven't seen explored is spoofing the index ( or Spi futures ) or using CFDs to spoof major components in an index

again this is more likely in thinly traded markets/days

now the 'market makers ' are supposed to provide default buyers/sellers either side of the NTA ( current portfolio value ) so in if theory there was already a short-selling attack on BHP , some 'noise ' putting worry on our big banks , and maybe that momentum can triggered some trailing stop-losses ,

now remember there were allegations of coordinated FAANG stock buying in 2019 to rescue the NASDAQ ( and others ) on bad days in the US , however it is less likely to be done by the Government/Central Banks in Australia ( therefore more likely to be detected and penalized )
 

Market Maker​


when applied to an ETF this can SOMETIMES give you a tiny extra opportunity when you suspect a major component will dip that day ( say CBA or MQG go ex-div , and most likely drop 2% or more on the day )

DYOR
 
CBA I put in $20k twenty odd years ago and still hold, EFT’s well sectors usually go up over the long term however I would rather hold individual stocks for periods more then a day and 2% up or down.
Opportunities arise all the time I fall asleep trying to find them, all for the grandkids, individual stocks or commodities will give you the best results, then I am 30% long term, 50% medium term and the other it’s win and loose invariably over the years a better win record.
Then again I don’t really know because I don’t know if I am astonishingly successful or a run of the mill punter who has spend the last 25 years preserving my capital with some cream.
I recently found out EFT was not just an Electronic Fund Transfer, hopefully I wake up to watch the tennis most likely the attendance might be 2% down on a Serbian tennis player going ex Australia.
but some members are new to the market ( very nice that you got started 20 years back ) but many others didn't for various reasons , but might want to soon , and some of those members may feel comfortable holding CBA for the next 20 years
 
XAO still following a very bullish trend around the long term upper limits. Bit of resistance here at 7800, you'd expect. While money continues to be pumped in and interest rates remain effectively -5%, this may continue. But, the can, can only be kicked for so long. Can the Feds pull off a miracle and reduce bond buying and increase rates to stop inflation, or?

On the upside, the channel is still being respected, generally. Downside, short and medium term support shown.

(edit: adding the longer term chart for some perspective on why I think those support lines might be tested.)

(edit 2: the chart could go parabolic too.)

(edit 3: breaking 8000 still keeps this in the longer term trend.)

View attachment 135715

View attachment 135716
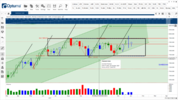
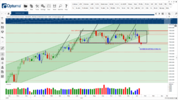
I'm not sure it is still that bullish, Sean. Technically yes. because we're still in a technical uptrend, but the XAO has fallen into a sideways flag pattern since the middle of last year, gone nowhere and been unable to hold above 7,900. The lower boundary of the smaller of the 2 rising price channels price is in (darker green in the chart) is providing support recently. It can still go either way - ie break down through that channel lower boundary (and correct if it breaks below 7,500 or break above 7,900 and head up to 8,000+. The break up remains my view of the most likely end to this pattern, but until Covid resolves I see the potential for more sideways action (and the spectre of inflation is a dark cloud on the horizon). The only positive is that the longer we drift sideways the greater the eventual rally might be (if it comes). And is it does rally then with the market back at new highs, tops of channels etc we still need a correction or bear market to reset. Not a great outlook for 2022 but as they say - life goes on! And, on that note, with the Nasdaq having slipped overnight and today a Friday, it could be another day to do something other than watch the market.
1642104497356.png
 
I'm not sure it is still that bullish, Sean. Technically yes. because we're still in a technical uptrend, but the XAO has fallen into a sideways flag pattern since the middle of last year, gone nowhere and been unable to hold above 7,900. The lower boundary of the smaller of the 2 rising price channels price is in (darker green in the chart) is providing support recently. It can still go either way - ie break down through that channel lower boundary (and correct if it breaks below 7,500 or break above 7,900 and head up to 8,000+. The break up remains my view of the most likely end to this pattern, but until Covid resolves I see the potential for more sideways action (and the spectre of inflation is a dark cloud on the horizon). The only positive is that the longer we drift sideways the greater the eventual rally might be (if it comes). And is it does rally then with the market back at new highs, tops of channels etc we still need a correction or bear market to reset. Not a great outlook for 2022 but as they say - life goes on! And, on that note, with the Nasdaq having slipped overnight and today a Friday, it could be another day to do something other than watch the market.
View attachment 135728

Agree on the flag. I should have added 'long term' before bullish trend, ref second chart. I'm short term bearish. The chart should revert to mean, and I've tipped 7200 for EOY simply based on the second support line and middle of the trend. Hopefully that's wrong for those fully invested and our superannuation funds.
 
Interesting day. Has undone the sea of green on goldies yesterday.

Has hit that first level of support again, I wonder if that's going to be it. Breaking through that has some support at 7400, but then it's 7200 ish to the downside.

Screen Shot 2022-01-21 at 3.08.02 pm.png
Screen Shot 2022-01-21 at 3.07.34 pm.png
 
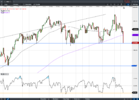
While we could be on the slippery slide to correction or beyond, the XAO is interesting in that the last all time high was an overthrow of the flag pattern upper boundary. Could it be that as today's move suggested the fall of last week might reverse (depending on what Wall Street does tonight - because the ASX doesn't have a mind of its own!), that the fall below the lower boundary could be seen as a small overthrow Quite often with patterns you will get these overthrows before a final break out. Could that be a break up out of the pattern? I'm still holding that a break up is more likely than a break down, while conceding the odds on that outcome lengthened last week.

1643006788735.png
 
Re my last post I just realised US futures are green as are ours (just) for tomorrow. So maybe a rally might be on the cards after all.
PS: I had flagged CSL and WES as trades I needed to close but will see what tomorrow brings.
 
While we could be on the slippery slide to correction or beyond, the XAO is interesting in that the last all time high was an overthrow of the flag pattern upper boundary. Could it be that as today's move suggested the fall of last week might reverse (depending on what Wall Street does tonight - because the ASX doesn't have a mind of its own!), that the fall below the lower boundary could be seen as a small overthrow Quite often with patterns you will get these overthrows before a final break out. Could that be a break up out of the pattern? I'm still holding that a break up is more likely than a break down, while conceding the odds on that outcome lengthened last week.

View attachment 136465

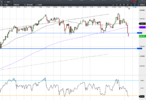
As you know, I'm a bear, but breaking the 200dma and through that support level turns me grizzly in the short term.
 
Woke up to see the US market was down 2% but that position seems to be improving - so maybe today won't be quite as bad as I had feared.
I checked all my trades and it was interesting to see how many had fallen to resistance and closed above their lows. Also a number of doji candles yesterday that suggest a possible reversal. In short, none said sell me. That said I'm under no illusions the current market is struggling. Fingers crossed.

PS: I usually watch the XAO but while trawling through my watch list this morning, I noticed the XJO had made a double top with its last early January high. I don't consider the XAO as making a double high as its highs are a little too different to be a technical double top. For what it is worth charting theory says that the XJO double top predicts a fall to around 6690 - 12% off its high and as such a formal correction. Hmmm - perhaps I better have another look at those stop losses.
We should see a rebound today.some will BTD, i will use it as a way to reload my put
 
US gone from red to green - so that looks better for our market. ASX futures are well under water but perhaps they just haven't caught up with the late US rally. Now all we need is for Mr Putin to stop playing brinkmanship with the US. I think Russia probably has more to lose than gain by invading Ukraine - hopefully Vlad the Impaler feels the same way.
 
Top