Australian (ASX) Stock Market Forum

Latest Inflation Figures

There is a theory out there called the SIP rule:

S = Shares
I = Interest Rates
P = Property

Shares usually lead the charge and money is poured into the market. Interest Rates begin to rise due to inflation. Market takes a dive and the money goes into fixed Interest deposits. Property starts to move. Interest rates fall. Money goes into Property.

A very simple theory that can be either a short or long wave. I used to have a graph evidencing these fluctuations which dated back to about 1912 I think? The biggest example in recent memory was that most of the money that went into the Share Market was 2 years previous to the 1987 Black Monday crash. Then with interest rates going up to 17% in 1989. House prices kept on booming right up until 1991. Short wave that time.

Anyways ..... it's just a theory.
 
Hi Timmy,

I posted this article in another thread but it would fit well here. The RBA does not appreciate the current CPI measuring too much apparently. I sort of agree. Why do all the other developed economies release inflation data monthly but Australia only quarterly? The article states Australian CPI was first compiled in 1960. But are we still calculating CPI using the same formula? Or is the "old" CPI better reflective of underlying inflation now?

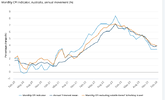
There is a really nice interactive annotated chart in the article comparing headline (CPI) vs underlying inflation with the annotations noting the official explanation for each move:

http://www.news.com.au/business/rba-says-cpi-data-not-representative/story-e6frfm1i-1225842175839

Thoughts appreciated.
 
Good article. The first thing that occurred to me was to ask what five measures of inflation the RBA does use.

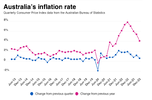
The second was to note that the graph, when updated with the most recent result, shows underlying inflation still below the headline rate of inflation.

I don’t know why Australia and NZ produce figures quarterly instead of monthly, certainly out of line with the rest of the world but I can’t find the reason(s).

This, from the ABS, is required reading as in introduction to the CPI:
6461.0 - Consumer Price Index: Concepts, Sources and Methods, 2009
http://www.abs.gov.au/ausstats/abs@...e=Summary&prodno=6461.0&issue=2009&num=&view=

There are 14 chapters, it is detailed, so you will excuse me if I don’t attempt to answer your questions (any attempt to do so by me would be inadequate). There are, though, some ‘summary’ points that might save you wading through the whole thing:
1.4 The CPI is reviewed and re-weighted every five or six years.
The last major review of the CPI resulted in the 13th series of the index which was introduced in the September quarter 1998.
Several important changes were made to the index at that time.

1.7 The 15th series CPI introduced in September quarter 2005 was also a minor review.
Once again, ABS published an Information Paper describing the changes:

• Introduction of the 15th Series Australian Consumer Price Index (cat.no. 6462.0).
 
timmy

a great study is this one

http://www.melbourneinstitute.com/people/tsiaplias/aere_491.pdf

the conclusion,,,


The ABS CPI measures headline inflation in
the household sector, while the trimmed mean
and weighted median measures attempt to
capture underlying (or core) consumer inflation.
Statistically, the underlying measures exhibit
lower volatility and higher autocorrelation
levels than their headline counterpart. These
properties are useful for capturing inflationary
trends, and the RBA relies heavily on the underlying
measures for assessing medium-term
inflation levels and benchmarking the effects
of monetary policy. There are several other
measures of inflation for the Australian economy.
The PPI measures inflation in the production
sector, the labour price index measures the
price of labour and the trade price indices measure
import and export prices
. Although the
consumption and non-consumption measures
capture prices for the same economy, their unconditional
contemporaneous correlation is insignificant.
 
Another reason wages have not risen quickly adding to inflation is undoubtably due to the high immigration rate.

i know in my field that I have many competitors who very recently came from countries such as UK and South Africa.
 
Latest inflation figures out today
upload_2020-4-29_16-7-17.png
the above graphic h/t @Robert__Rennie from Westpac on twitter.

So inflation as of end of March was 2.19% YoY. up from December! All measures of core inflation were up YoY compared to December.

That's with a crashing oil price, Auto fuel down -6% QoQ.

So much for a deflationary impulse?
 
Latest inflation figures out today
View attachment 103053
the above graphic h/t @Robert__Rennie from Westpac on twitter.

So inflation as of end of March was 2.19% YoY. up from December! All measures of core inflation were up YoY compared to December.

That's with a crashing oil price, Auto fuel down -6% QoQ.

So much for a deflationary impulse?
Drought and bushfires.

yes, but wait for end-Jun
 
Australian Inflation figures have come in below expectation, all but ruling out another rate hike next Tuesday.
From Evil Murdoch press
1706664125812.png
Inflation has slowed sharply to 4.1 per cent in the year to the December quarter, from 5.4 per cent in September, virtually ruling out another rate hike at the Reserve Bank’s first board meeting of the year on Tuesday.
Consumer prices lifted just 0.6 per cent through the final three months of 2023 – the smallest increase in nearly four years – or half the 1.2 per cent in the September quarter, the Australian Bureau of Statistics data showed.

The consensus among economists had been for annual consumer price growth to drop to 4.3 per cent.

There was even better news in the more timely – if less complete – monthly price figures, which showed inflation plunged to 3.4 per cent in the year to December, from 4.3 per cent in November.

The biggest price increases in the quarter was a 7 per cent jump in tobacco, a 3.9 per cent increase in domestic holiday costs, and a 1.5 per cent rise in the price of newly built homes, where annual inflation was steady at 5 per cent against a peak of over 20 per cent in September 2022.

Mick
 
Latest inflation figures show persistent inflation.
Nothing to indicate a rate cut anytime soon.
Mick
From ABS

Key statistics​

  • The monthly CPI indicator rose 3.4% in the 12 months to February.
  • The most significant price rises were Housing (+4.6%), Food and non-alcoholic beverages (+3.6%), Alcohol and tobacco (+6.1%) and Insurance and financial services (+8.4%).

Overview​

The monthly CPI indicator rose 3.4% in the 12 months to February, following a 3.4% rise in the 12 months to January.
The annual movement for the monthly CPI indicator excluding volatile items and holiday travel was 3.9% in February, down from the rise of 4.1% in January. This series excludes Fruit and vegetables, Automotive fuel, and Holiday travel and accommodation.
Annual trimmed mean inflation was 3.9% in February, up slightly from 3.8% in January.
1711500032961.png
 
We all know why.


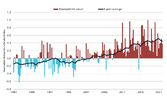
Actuaries specialise in assessing the financial consequences of risks, and are often employed by insurers, banks and investment managers. The Australian Actuaries Climate Index (AACI) tracks changes in the frequency of extreme temperatures, heavy precipitation, dry days, strong wind and changes in sea level across Australia, ‘because extremes have the greatest potential impact on people and, often, the largest cost to the economy’. The AACI shows significantly worsening extreme weather risk, shown by an index number above zero (see Figure 1).


NaturalDisastersClimateRisk-001.png
 
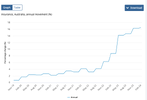
Anyone wondering if Insurance has gone up a bit recently need only to look at this chart for confirmation
Mick
View attachment 173498
in 2 years my house and contents went from 2500 to 3700 . On the last policy increase i shopped alternatives and got insurance with no flood cover for 2200 , Given i live half way up one of the taller hills in Brisbane forgoing flood cover was a no brainer given if my place flooded every CBD buidling up to 50 stories high is submerged . The insurer i was with didnt have no flood cover option , was great to find that option
 
in 2 years my house and contents went from 2500 to 3700 . On the last policy increase i shopped alternatives and got insurance with no flood cover for 2200 , Given i live half way up one of the taller hills in Brisbane forgoing flood cover was a no brainer given if my place flooded every CBD buidling up to 50 stories high is submerged . The insurer i was with didnt have no flood cover option , was great to find that option
my insurer was very disappointed i rejected flood insurance on the new digs , given the extra premium and considering the house is roughly 600 metres above ( current ) sea level ( and one of the highest sites in the district ) i assume the Brisbane head office will be well under water by the time i need to submit a claim .

and the 'flood cover' premium was an insult to my maths skills as well

now sure an F-35 has a higher chance of landing on the roof than flood damage , but try getting covered for that
 
Nothing to indicate a rate cut anytime soon.
My guess is things will get "interesting" in the market once the masses realise this.

It's one of those things that'll take far longer to occur than logic says it ought but I expect it'll be real quick once it finally dawns as to the true nature of the situation. :2twocents
 
Top