Australian (ASX) Stock Market Forum

Gold Price - Where is it heading?

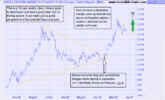
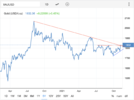
I usually only look at gold on a quarterly basis but today I can see more in the long term weekly chart. It may be about to break out on the upside of a normally bearish descending triangle. The price has mostly been riding high in the triangle until now where it appears to be taking a bounce upward off the straight base of the triangle. I am really quite bullish about gold as it runs in line with inflation and I can see so many commodities either at the beginning of a big hike such as coffee, wheat, etc along with so many other commodities which are well into their runs upward. Of course, the Biden administration will be blamed for all of this but it has been in the making for some years now.... for example, gold bottomed in December 2015 and has had higher lows ever since. Genuine inflation takes a long time until it blossoms. It is like any other oscillation over time. Small-minded people like to point fingers of blame at normal events which occur on a rotational and oscillating basis. That is why I like to look at the very, very long term. It is the only way to see the truth of all things.

gold weekly 10.2022.png

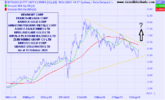
Right, now that I have said that, how best to profit from this potential rise in gold? Pretty much name your poison, there are so many gold stocks of all kinds and shapes and prices just depending on your stomach for risk. There is one stock you won't be seeing in the stock lists up the top of the forum, it is the exchange-traded fund MNRS. As far as its chart is concerned it is still locked in a Symmetrical triangle and it is still riding under the 200dma It is an ETF that carries the major international gold miners. It also pays an unfranked dividend currently of around 3.5%ish. My guess is this should rise and fall pretty much in line with the gold price. I would suggest it to those more conservative amongst us. I have its main constituents listed on the chart, I won't bother to write them up again now. Happy trading folks! :)

mnrs 15.10.2022.png
 
I usually only look at gold on a quarterly basis but today I can see more in the long term weekly chart. It may be about to break out on the upside of a normally bearish descending triangle. The price has mostly been riding high in the triangle until now where it appears to be taking a bounce upward off the straight base of the triangle.

That's the handle on a 10 year cup, Ann. Target around $2600 ish.
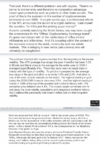
 
That's the handle on a 10 year cup, Ann. Target around $2600 ish.
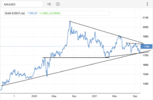
Yes sure is Kennas, and it is also very close when I draw a swing trade/measured move from the top of the triangle to the first touch onto the base. Confirmation you reckon? :)

Edit Nope, I am wrong....
 
Trade the Trend *Gold analysis & Gold stocks to watch


Interesting that Jason seems to suggest that "bullish sentiment" perhaps coming back into Gold stocks over the next couple of month's.

I happen to be loaded & ready in some Goldie's WMC & OGC respectively as potential big near term catalysts in play coming up over the next few month's (DYOR as always)

Cheers tela :)
 
There's something really brewing here, both on the USD POG and XGD. They seem to be converging to a tipping point; for a break up, or down. And, it doesn't seem like you want to be on the wrong side of either to me, if you're long or short. No time frame on it, but it's winding up in all time frames. It seems like it's either a significant move up, or down, at some stage. Just need to be relatively nimble. Very interesting to see this play out.

Screen Shot 2021-11-05 at 9.31.24 pm.png
 
Reading from this link is preferable to me trying to dissect the overnight jump of 1.8% in POG.
The near-term resistance level is $1833 or another 1% jump from today's $1816 close.
After that we need to break $1920 for the rally to be considered as having resumed.
1636148123793.png
 
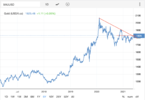
Important juncture here, as we've been commentating on for a while. Now facing significant horizontal and downtrend resistance at this point. A weekly close above these lines will be significant.

There is still space for more consolidation in the flag of course. Can still go as low as 1680 before a major breakdown.

Screen Shot 2021-11-09 at 9.08.17 pm.png
 
USD POG now at 1832, above the Jul and Sep highs of 1829 and 1826 resistance points. The downward diagonal line is about the same point, so if there's a break through it beats a couple of key resistance levels. It's not an algo chart so might be off a few notches. I've read on Kitko, chartists calling 1835 the key resistance level.
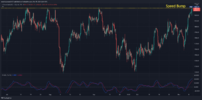
It's been a solid run since the Sep 29 low of 1725 with a couple of bouncy bouncies*, so expect another breather shortly. Perhaps it will be at this diagonal resistance level, but making a higher high is now the first step on the way back to 1900, then 2070, and then the 2600 ish giant C&H target.

Having said the above, I'll hedge my bets with the fact there's a huge comet heading towards Earth.

Screen Shot 2021-11-10 at 8.03.53 am.png

*TM @finicky
 
USD POG now at 1832, above the Jul and Sep highs of 1829 and 1826 resistance points. The downward diagonal line is about the same point, so if there's a break through it beats a couple of key resistance levels. It's not an algo chart so might be off a few notches. I've read on Kitko, chartists calling 1835 the key resistance level.

It's been a solid run since the Sep 29 low of 1725 with a couple of bouncy bouncies*, so expect another breather shortly. Perhaps it will be at this diagonal resistance level, but making a higher high is now the first step on the way back to 1900, then 2070, and then the 2600 ish giant C&H target.

Having said the above, I'll hedge my bets with the fact there's a huge comet heading towards Earth.
And that comet will take the form of the likes of JP Morgan and the other big banks piling on the shorts in the paper trade on the CME,
History has a habit of repeating.
Mick
 
USD POG now at 1832, above the Jul and Sep highs of 1829 and 1826 resistance points. The downward diagonal line is about the same point, so if there's a break through it beats a couple of key resistance levels. It's not an algo chart so might be off a few notches. I've read on Kitko, chartists calling 1835 the key resistance level.
Highest close since July was $1832, so Kitco's resistance at $1835 is just rounding, not that a few dollars will make much difference.
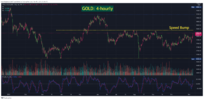
I have tracked TSI on 4 hourly charts to get an idea of how much more upside is possible, and where we are today is similar to where we stood in May. That continued to over $1900 in June, so maybe we get a repeat before a major retracement.
1636498997834.png
 
Highest close since July was $1832, so Kitco's resistance at $1835 is just rounding, not that a few dollars will make much difference.
I have tracked TSI on 4 hourly charts to get an idea of how much more upside is possible, and where we are today is similar to where we stood in May. That continued to over $1900 in June, so maybe we get a repeat before a major retracement.

These guys are picking $1837...

We have been forecasting that gold would challenge and breach $1837 by the end of 2021. We have also been forecasting that gold would challenge $1900 per ounce in gold by end of the first quarter of 2022. Although when I first put forth our short-term and longer-term forecast it seemed as though those numbers were out of reach. Considering that gold today has risen for the fourth consecutive day and as of 5:55 PM EST is fixed at $1833.80, a net gain of $5.80 and traded to a high today of $1834.80, the forecast seems more realistic than 2 months ago.
 
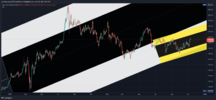
Below are medium term (2 year) and short term (5 month) trend envelopes:
1636537871053.png
Short term median close at end of year is $1850.
Medium term close is well over $2000.
I personally don't yet see what would trigger POG to jump massively any time soon. There does not seem an appetite for its safe haven status, and global markets generally are not in such bad shape to spawn a rush to gold.
 
US markets shocked overnight by highest inflation rate - 6.2% - in over 31 years.
Gold jumped over $40 as a result, but was pared down to half that increase 6 hours later.
So the $1832 hurdle was smashed and we now want to see $1920 tumble for a continuation of the medium term trend to be locked in.
2w8hGf0D

https://www.tradingview.com/x/2w8hGf0D/
 
Top