Australian (ASX) Stock Market Forum

Gold Price - Where is it heading?

Sorry all, "I didn't realise there were so many chartists in this thread. I had started a thread on "Gold Charts"

I will ask @Joe Blow to transfer the post here and delete the thread..

It basically related to EW and what I see as a wave 2 forming in all time parameters 6 mo. and longer.

So it may drop a bit but then Golden Days.

gg
 
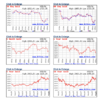
Yes, thanks @Joe Blow . So basically with ref. to what I posted last night I will now continue my spiel, with an updated set of Kitco.com of the $USD/Oz Gold charts over different time frames to tonight.

In all from the 6mo. chart and beyond the 6mo.chart, gold is in an EW pattern Wave 2, with the sub-pattern about to complete it's 1-2-3.

Now it looks to me as if a Wave 3 is about to develop, i.e. a re-rating of gold to bullish.
I've been so busy with rare earths ( they are very heavy ) I have omitted to complete the post from above and I apologise.

I feel it is again time to look at gold.

Screen Shot 2021-08-13 at 10.14.45 pm.png
gg
 
In all from the 6mo. chart and beyond the 6mo.chart, gold is in an EW pattern Wave 2, with the sub-pattern about to complete it's 1-2-3.

Now it looks to me as if a Wave 3 is about to develop, i.e. a re-rating of gold to bullish.
Yes I agree that the very long term future looks very good for Gold. Your EW analysis, wave three is the big one, also we see a cup and handle pattern on your ten year chart, very bullish, and the market is trying to get on the track of the Gann 90 year cycle, also very long term bullish. The fundamentals are good for Gold & Silver when the economy gets moving and all the new tech is being built for EV and automation. Keeping all these in mind, I like monitor and keep reassessing what is happening.
 
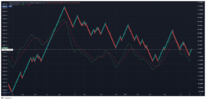
Looking at price action alone (via a renko chart based on ATR box size of $30), gold was triggered to BUY in April (TSI inflection).
1628919673000.png
Using a $10 box size we get more trading opportunities, and can refine trading dates.
1628920908636.png
In this case the most recent trigger was 11 August and confirmation (based on 2 box movement, ie. above $1770) occurred during trade on Friday 13th.
As I believe all the ingredients for a gold bull market remain intact, the pattern we are in may repeat the bull cycle that ran from September 1999 to August 2011. As the present bull cycle kicked off in January 2016 we might have another 5 years of price appreciation ahead.
 
Bought some PMGOLD ETF when gold was 1733ish USD on wednesday. For me probably a never-sell, short of massive increase sparked by a real re-jigging of stuff. I believe in the thesis for silver similarly, but the only ETF on ASX that covers silver alone has too high a management fee for my liking. PMGOLD only has 0.15% per annum management fee, so can forget about without fear of it being nibbled away too quickly.

I'm no Schiff-style gold bug, but IMO theres maybe a 10-20% chance in the next 2 decades that gold repeatedly multibags based on today's prices. Definitely seems worth having some skin in the game on that possibility.
 

BULLISH HAMMER IN GOLD POINTING TO NEW ALL-TIME HIGHS BEFORE YEAR END.​


well that is depressing

i was hoping to calmly and opportunistically add more gold stocks in the coming year

DYOR

elitetrader.com/et/threads/when-perfect-hammers-fail.68812/

the thing about using technical analysis from books is that it's an attempt to do colour-by-numbers, all the standard colours maybe there and they make recognisable sense, completing a picture, however, nuances and shades n light etc make the difference in pictures as much as context makes in a chart, its a presentation of intent, by interpretation.... if the exponent merely cherry picks a single thing without at least providing two contexts then the odds of being on the wrong side of the trade go back to 50/50 ......
 
The price of gold has poked through the $2500 handle.
This is thanks to falls in the AUD in most recent days, so perhaps some investors/traders have missed ithe run up due to only looking at the USD/Gold price.
At these prices, one might expect some improvement in the ASX goldies, but they are still languishing somewhat.
If these prices hold, or even better , keep going up, it will likely transform into improved prices for gold stocks.
Mick
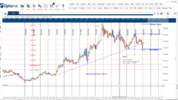

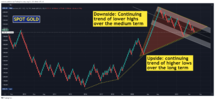
yes , but sadly i was hoping for lower gold stock prices, because i was hoping to buy more of them

oh well
 
Here's a bit of charting mumbo jumbo that suggests gold could be about to recover. If you aren't into charting I'd probably suggest you not bother reading the analysis.

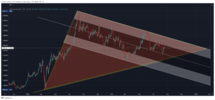
Gold hasn’t done me any favours recently. When GLD fell to a long-term support (blue dashed diagonal line) and then rose to break a weekly downtrend I saw it going higher and bought into a couple of gold stocks (NCM and EVN). Price rose to $1,900 making a new technical weekly uptrend in the process before rolling over and falling back heavily. I held on the basis price should kick up if/when it reached that long-term support line, however, price fell through said support by 4.5% to stop at the next support level below (around $1,680). Last week it moved up to close above that support making me a little more confident of the outlook for the precious metal.

Technically, price has not made a new weekly downtrend in the recent fall, so by definition it remains in an uptrend – another positive.

The week before last made a hammer candlestick which is a reversal candle when at the bottom of price action. The closing price for GLD has risen for the past 2 weeks (although last week was only up $1).

Elliott Wave Theory, while always a bit subjective, suggests that if the low of 2 weeks ago was a significant low then price is probably on Wave 5 which, if correct, means price should go back above the August 2020 high of $2,080. The recent rise to $1,900 and pullback to $1,680 could be Elliott Wave sub-waves 1 and 2, and if so, price could now be expected to rise strongly in sub-wave 3 until a theoretical pullback around $2,070 (a 161.8% Fibonacci extension of sub-wave 1 from the bottom of sub-wave 2). $2,070 is very close to the all-time high for GLD which is a significant resistance level that could cause the pullback mentioned.

Finally, Time Theory suggests price may change trend when it meets a time line. Time Theory is a bit Dr Whoish and even more subjective than Elliott Wave. While I don’t regularly use it in my day-to-day trading, it is always in the back of my mind. GLD seems to travel to a 72 days cycle. The vertical lines on the chart are 72 day cycles and while price hasn’t changed direction at every time line, it did at 8 of the last 9 time lines prior to the one that coincides with the low 2 weeks ago. Again, this suggests price is likely to move up.

1629534485794.png
 
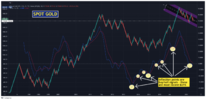
My medium term take on POG based on renko chart style:
1629589430274.png
Pennant formation with momentum to the upside.
Breakout needed at $1875.
In candlestick chart style it looks a bit easier:
1629590158528.png
My thinking is that breakout to the upside is 2 to 4 weeks away.
But any further sharp declines can push this into end of year.
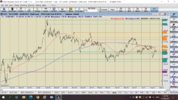
 
My thinking is that breakout to the upside is 2 to 4 weeks away.
But any further sharp declines can push this into end of year.
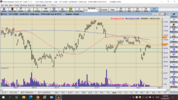
I have a couple of charts that do indicate more down for Gold. The first chart below shows the 50 day MA and the 200 day MA are both down and price is still below them both.

1629603166441.png

The next chart shows that the volume falls for the recent up move and the 'up move' itself is short, four days, then stalls at resistance. These things alone don't signal another fall in the Gold market but they are not supportive for the up move to continue at this time. Next week will give more clarity to the direction of Gold.

1629603641652.png
 
Top