Australian (ASX) Stock Market Forum

Futures trading journal - GB

I notice it in the recent posts column but don't open the thread to read it as there's little commentary. Posts with +41, -16 etc don't raise my interest. However if you were to post a summary at the end of each week or two this would be interesting. I would look to see if your results were improving and the cumulative result. Regular updates would emphasise that trading is not a get rich quick activity. It takes a lot of work, with lots of small losses and the occasional win. Overall we earn little by little.

With that being said (or written), I would hope that you are gaining more from the regular posting than the readers. Posting should make you think more about what you've done, highlight your common mistakes and make you think about how to reduce them.

I post regularly, in order to think about what I've done and what I can do better. I notice when I'm out of sync with the market, more quickly when I post regularly.
 
Keep sharing your knowledge
@Gringotts Bank, I want to encourage you to keep continuing to share your experience. Your thread has received over 45,000 views, which shows that people are interested in what you have to say even if they do not post comments. You clearly have valuable insights to share based on your trading experiences so far.

It's understandable you feel discouraged when posts don't receive direct feedback. But the high view count is evidence that people "are" paying attention. So keep your focus on the journey even though active engagement may seem low right now, stay persistent. By consistently providing your unique viewpoint and ideas, you will gradually build up a group of traders who connect with and learn from you.

GB.jpg
Skate.
 
Thanks for the feedback guys - I thought I might have been talking to myself. The thread did get a bit dull recently with me only posting entry prices and W/L. Might do it a bit differently going forward, not sure. Probably not a lot of people up at 2am.

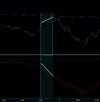
Last night's opening 10 min had a large divergence vs the delta volume (bottom pane). That was the only real interest.

x.png
 
Hi GB,your thread is one I read if I come in. Bigdog's and Captain's too. I don't go round searching for these threads. Will read if I see it on the page.....bit lazy looking for things.

I suspect many don't understand what is being posted (I should speak for myself) esp the abbreviations, GB.

Thank you for posting.

Thanks esk. Most can be figured out, but these are the main ones.

ES: E-mini S&P futures contract.
L: long (usually 1 contract)
S: short
BE: break even
+/-40: profit / loss of 40 ticks (for ES, one tick is worth $12.50)
SL: stop loss price
T: target price, for long or short
TL: trendline
5m: 5 minute chart

---------------------------------------------------------------------------------------------


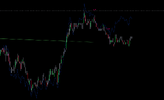
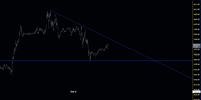
Right now, there's a TL seen on the 5m. I expect it to breakout, then fail to meet its target, triggering a bit of a sell off. Currently, it's moving up strongly.

Since it hasn't broken out yet, the TL target is unknown, but it will be around 4600.
x.png
 
Hesitation, then a backing off the TL. Now a powerful move through it. TL target 4599.5.

L 4584.25
 
Last edited:
I like your post with the price vs delta volume divergence. How often does this appear? Can you use it as a trading setup?
 
I like your post with the price vs delta volume divergence. How often does this appear? Can you use it as a trading setup?
I've only started using it recently, so I don't know. Can be unreliable because it's not a 'true' cum volume delta - it's a proxy. Instead of referencing bid-ask tick volumes, it references 1 second data and makes a reasonably accurate guess at what's happening. So I use it as confirmation.

There was another one last night.


x.png
 
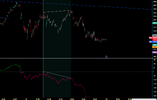
Divergence easier to see when the delta vol is overlaid.

Blue line - is this bullish divergence or bearish? I think it can be interpreted either way.

The blue line is saying there's a lot of buying but the price isn't rising. You could call that bearish because the effort (volume) is not resulting in reward (price rise).

ok, it's moving down now. So probably bearish!

L 4590 -- this is based upon my system.


x.png
 
Last edited:
This is harder to inerpret. Delta is falling, but price is rising.

Would you call this "ease of movement" or something else? Or nothing in particular?

x.png
 
Top