Australian (ASX) Stock Market Forum

Futures trading journal - GB

The stop loss levels for my losing trades are very often good levels to buy at. Like last night where I exited at 4580, which was immediately followed by 100+ tick rise.

So I'm thinking about adding 1 contract at the usual SL and seeing how often I can get out at BE. Would only do this if the market isn't trending down too strongly.

Tonight, I'm hoping to enter first long trade at 4594.5. No position yet.
wow that worked well. Almost like the market read my mind.

Entered at 4594.5, added one at 4584.5 then out at BE minutes later.

New long...

L 4589.5

4594 now becomes a critical level. If it doesn't break through that, it coud begin a move down.
 
Last edited:
Interest rates at 4am. My guess is the price may head down, so will need to exit b4 then. If 4594 isn't broken above by then, I'd be quite bearish.
 
Interest rates at 4am. My guess is the price may head down, so will need to exit b4 then. If 4594 isn't broken above by then, I'd be quite bearish.
-20

I got out with what I could before the news.

Once again, my fixed stop level (4579.25) proved to be an excellent long entry. There's amazing symmetry & order among the apparent chaos of ES.
 
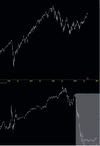
Top pane is 1D chart
Bottom pane is 1m chart (last night).

Is it a fractal or am I imagining things?? If it is, we might get some of the shaded area soon.


x.png
 
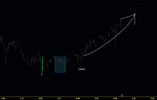
A bottom.

Sharp, high volume zig (green), followed by 'tic-tac' pattern (boxed). Tic-tac is when the zigzag is making tiny up and down moves with very low volume and volatility. (aka 'volatility contraction', though I don't use this term because the volume also has to contract).

The green line is the initial signal of bullish strength. It puts everyone on notice. The tic-tac is signalling that both the bulls and bears are retreating in expectation of a volatility expansion. It re-tests, then up she goes.


x.png
 
Top