Australian (ASX) Stock Market Forum

Futures trading journal - GB

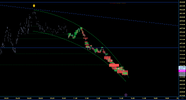
Pulled up short of the TL (orange arrow), and now is narrowing in volatility. Same downwards pattern.

Nothing much in the way of support until 4138.5. Once again looking for stopping volume on candlevolume. You can see an effort to reverse at 4147, meaning those green pivot lines were on others' radar, but they didn't hold.

x.png
 
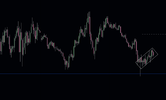
H&S bottom. Not a huge amount of buying overall, so expecting a bumpy take off. There's a fair chance it may revisit the head bar lows and then the H&S must be deleted from the chart. Big stopping volume and quite a lot of buying in the candle forming the 'head'.

x.png
 
ES: The move up from the lows of today were pretty weak. Trade didn't reach my target, but I exited early with a small profit. Too flat, not enough buying. Just looks like it's going to continue sideways or down for the moment.

You can see it on the 20 min. There's just no attack in the move up.

x.png

What's up @Modest ? How are you reading it?
 
Both ES and gold charts are getting very messy. High entropy, with all the waves on different TFs opposing each other. Not a good time to trade until things smooth out. I think the new direction will be down.

x.png
 
Much more confident now. I think it's going way down over the next few days, but not quickly.

Short, targeting 4097. Wide stop.

Would have been much easier if I'd just shorted when I first mentioned it was toppy, and held on through the swings, but I can't trade that way without tick data. TV's only drawback is the lack of historical tick data.

If the trade works out, I'll remember the interference pattern comes before a fall because it was quite marked on my charts.
 
Last edited:
Quicker than expected. 4097 was a daily and weekly FVG combined. Weekly FVGs can rebound 50% which would mean quite a big move up from here, but I'm not feeling it. At the moment, I don't think it will even get above 4120.25 before heading back down to rebalance more liquidity at 4097.
 
When waves break and the water moves up the beach, at some point it pauses and flows back out to sea with momentum causing a backwash wave. When a backwash wave meets the next incoming wave, this happens.

Think of the incoming wave as the sellers, and the outgoing backwash as the buyers. When they meet, there's a superposition and a spike in volume.

x.png

Same vibe.

x.png


Yesterday really hurt the market. Very muted bounce off the Weekly imbalance is a bad sign. If it creeps up to 4120.25, might be a good short..
 
Several levels where it could potentially bounce. Second problem is we're now in a downtrend, so going long becomes risky. Mainly watching the order flow to see if buying coincides with any of the levels I've marked. 4078.25 is the next weekly imbalance gap - that's my guess. If not 4070.
 
Second problem is we're now in a downtrend, so going long becomes risky.

Don't you feel like if all it takes is price retracing a ~10% up move by -2% when VIX is at 19 (implied market move of 1.2% daily move) to switch your thinking to "we're in a downtrend", you might just be trading on noise?
 
Don't you feel like if all it takes is price retracing a ~10% up move by -2% when VIX is at 19 (implied market move of 1.2% daily move) to switch your thinking to "we're in a downtrend", you might just be trading on noise?
No. Have a look at my results.
----------

Long at 4105.75. Prepared to add one lower if it reverses. Buying intensity is only medium, but two TL's crossed.

edit: will add one at 4091.25 if needed.
 
Last edited:
That got ugly very fast. Picked up and extra one, then promptly sold both for a loss.

It even got down close to the second weekly FVG at 4087.25, and there's just no buying to be seen on the push back up. Not looking good for ES.
 
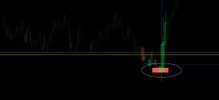
First sign of real strength in over a day, circled. That's a long time on a 1 min chart.

Too difficult to tell if there will be any follow through with the TL break. I doubt it.

Looking at next buy around 4088.75, 4078.25 or 4073.50.


x.png
 
First sign of real strength in over a day, circled. That's a long time on a 1 min chart.

Too difficult to tell if there will be any follow through with the TL break. I doubt it.

Looking at next buy around 4088.75, 4078.25 or 4073.50.
4073.5 provided support, but not exact.

The rebounds continue to be insipid. There's a lot of imbalance overhead. To rebalance the whole chart, would need to get to 4131.5. Will happen at some point. Another 1 or 2 days of weakness?
 
This move up is much more healthy (plenty of FVGs indicates aggressive buying). Finding it a bit hard to get a buy set up though, which makes me think I won't get a pull back. It may just continue grinding up slowly.

edit: long at 4096


x.png
 
target 4107. Could go higher (perhaps even 4131), but I'm feeling that wherever the peak occurs, there will be another big sell off afterwards. In other words, a dead cat bounce.
 
Top