Australian (ASX) Stock Market Forum

Futures trading journal - GB

Stopped out.

Long 4161. tgt 4177.5.
Out again. Small loss. Not waiting for the stop.

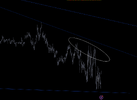
Here's what I just noticed. 3 peaks not meeting trendline. Have added this to my checklist. Checklist has a total of 8 points. Points 1 and 2 take ages to set up each day. The rest are very easy to eyeball and only take a few seconds - this is one of them.


x.png
 
The Vic2b pattern. Needs a peak of say 30 ticks in between the two lows to be considered. Both occured about mid-session (yellow band).


x.png
 
Gold pulling away from the trendline. Steering clear of that til it behaves.

ES may get to 4203.25. Narrow and steep-ish regression channel is bullish.

Not expecting anything higher than 4215.5 tonight.
 
Stopped out.

Long again at 4181.

I've gone from purple patch to losing streak. What's going on? :confused:
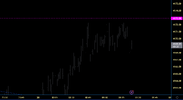
And again, stopped out.

That's the max for one day, so I'll just watch now. See if I can work out where I went wrong, if possible. Maybe it's just one of those days, or two days.
 
Identified one error on my part (going long too close to a level) and the other trade was just bad luck.

No excuses here, but tops are difficult, and the ES has been toppy for days. The market gets twitchy as the banks creep closer to their predetermined level, which I think is somewhere between 4203.25 and 4215.25. After that, I think they will take it back down.

Early long @ 4176.5 tgt 4186.5. A stealthy night session trade.

Allllrighty. Take care now. Bye bye then.

 
Oviously an early sell off (1 min TF), which is cascading/accelerating. It's not a narrow regression channel, so that's good, and in fact there's been a reasonable amount of buying on the way down which makes me think it's accumulating for a big run up during the RTH.

In the last 3 session there's been a Vic2b to start the run up, so will look for that again. Each 2b pattern has had 30 tick peak in between the 2 lows that form the pattern. Will also watch the Murray Maths lines for an entry. Ideally both the MM and the 2b pattern together.

The MM line I plot is level 4 (L4). Decent indicator for a low swing point when it's crossed and there's a volume expansion on the same bar.
 
Down, down, down, but the big players are buying. Haven't seen this before. I can only assume there's going to be a big pump, but what do I know? My targets are usually quite modest. This time, I'm going for an ambitious 4203.25.
 

Attachments

  • x.png
    x.png
    135.7 KB · Views: 4
Last edited:
If it has trouble getting past 4173, I'll sell. I don't think that will happen at the moment. 4173 break tells me we're still in uptrend on a higher TF.
 
Last edited:
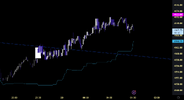
3 pushes up towards 4173, but staying 3 ticks shy of it. Finger on the sell button, hoping not to use it.


x.png


Equivolume. No blow off tops, indictaive of more upside potential. Looking for it to punch through that level.
Also shows heavy selling at first touch of the blue trendline I've drawn, telling me it's relevent.

x.png
 
That target is not gonna happen obv.

-----------------------------------------------------------------------------------------------------------------------------------------------------------------

Next time I see that buying during a downwards move, I will be paying attention. It can signal a 'thick' run up before it dumps.

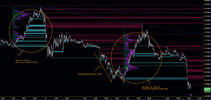
The move up (4150-4187) was characterized by little buying and a very thick volume profile (thin FVG). It ran a fair distance because it had to rebalance all that buying. But that swing up was net distribution.

VP and FVGs are almost the inverse of each other. Both shown here.

Now, bearish AF with a complex inverted H&S visible on the hourly chart. 'Complex' means there's 4 or more 'shoulders'.

x.png
 
Top