Australian (ASX) Stock Market Forum

Dump it Here

One Investment Suggestion is to "Buy the ASX20"

ASX20 Index Investing - A Flexible and Consistent Approach
The simplicity of this investment strategy lies in its flexibility as you can start at any time. Whether you begin with $100,000 or a different amount, the percentage return remains consistent. Beyond annual rebalancing, there’s little else to manage. This type of investment strategy allows you to enjoy the fruits of your well-executed plan for many years to come.

Explore the potential of ASX20 Index Investing
By distributing your trading funds among the top 20 companies listed on the ASX, you’re not just diversifying your portfolio, you’re also tapping into the market’s fluctuations at the top end.

Embrace Market Movements
When you invest in the entire index, you embrace the ebb and flow of natural fluctuations, celebrating gains and weathering losses. It’s a total approach that mirrors the full spectrum of the ASX20.

Equal Weighting - Stress-Free Investing
By allocating equal weight to all positions, you eliminate the pressure of selecting individual winners. This straightforward strategy simplifies your investment approach.

Unseen Benefits - The Complete Picture
The graphic below captures the capital gains, yet it’s just the beginning. When you factor in Dividends and Franking Credits, these additional benefits significantly increase your returns. This method doesn’t just outshine traditional banking investments, it also showcases the intrinsic value of placing your trust in established, reputable companies.

Annual Rebalancing - Keeping your Portfolio Aligned
Maintain the harmony of your portfolio by conducting an annual rebalancing on the 12-month anniversary. This disciplined practice ensures that your investment stays in step with the evolving index composition.
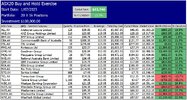

ASX20 Buy and Hold Strategy.jpg

Skate.
 
ASX20 Index Investing - A Flexible and Consistent Approach
The simplicity of this investment strategy lies in its flexibility as you can start at any time. Whether you begin with $100,000 or a different amount, the percentage return remains consistent. Beyond annual rebalancing, there’s little else to manage. This type of investment strategy allows you to enjoy the fruits of your well-executed plan for many years to come.

Explore the potential of ASX20 Index Investing
By distributing your trading funds among the top 20 companies listed on the ASX, you’re not just diversifying your portfolio, you’re also tapping into the market’s fluctuations at the top end.

Embrace Market Movements
When you invest in the entire index, you embrace the ebb and flow of natural fluctuations, celebrating gains and weathering losses. It’s a total approach that mirrors the full spectrum of the ASX20.

Equal Weighting - Stress-Free Investing
By allocating equal weight to all positions, you eliminate the pressure of selecting individual winners. This straightforward strategy simplifies your investment approach.

Unseen Benefits - The Complete Picture
The graphic below captures the capital gains, yet it’s just the beginning. When you factor in Dividends and Franking Credits, these additional benefits significantly increase your returns. This method doesn’t just outshine traditional banking investments, it also showcases the intrinsic value of placing your trust in established, reputable companies.

Annual Rebalancing - Keeping your Portfolio Aligned
Maintain the harmony of your portfolio by conducting an annual rebalancing on the 12-month anniversary. This disciplined practice ensures that your investment stays in step with the evolving index composition.


View attachment 177318

Skate.
creates an interesting picture when you equal weight rather than use Market Cap. doesn't it ?
 
creates an interesting picture when you equal weight rather than use Market Cap. doesn't it ?

Investing Made Simpler - A Strategy for Everyone
@divs4ever, the purpose of this exercise is to present an investment approach that aims to minimise stress. While the concept of ‘stress-free’ is indeed subjective, this strategy offers a straightforward path for those looking to navigate the markets with ease. It’s more than just an idea, it’s a practical solution for hassle-free investing.

Skate.
well i did have concerns on a market cap. based TOP 20 ( and 50 ) ETF , due to certain sectors overwhelming others

but this strategy may have extra benefits i guess time will tell
 
well i did have concerns on a market cap. based TOP 20 ( and 50 ) ETF , due to certain sectors overwhelming others

but this strategy may have extra benefits i guess time will tell

@divs4ever, I believe some may find value in following along with this ASX20 investment journey, so I’ve decided to share the ongoing weekly results every Sunday morning, to shed light on its progress. Ultimately, this investment approach aims to provide transparency, allowing others to explore the markets' potential rewards.

Skate.
 
I knew you could do better than using the MACD-V. It's a useful indicator but needs a bit of help in a trading system.

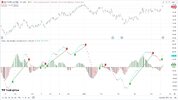
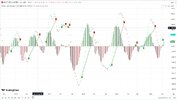
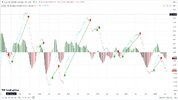
@peter2, building upon Alex Spiroglou’s work, I’ve refined the MACD-v indicator by adding advanced customisation features similar to Amibroker’s "param" functions. This enhancement not only rectifies the original MACD-v constraints but offers a suite of customisation options, including a unique volatility calculation method, addressing the original indicator's limitations. Also, the refined version of the enhanced MACD-v Indicator acts like a smart assistant simplifying the decision-making process. Notably, the advanced version of the MACD-v Indicator maintains consistent performance across different time periods, making it a versatile tool for any trader.

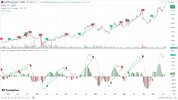
RIO Tinto Daily Chart
RIO Tinto’s Daily Signals indicate an active trade position.

RIO - Daily.jpg


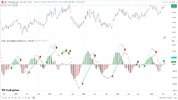
RIO Tinto Weekly Chart
RIO Tinto’s Weekly Signals indicate an active trade position also.

RIO - Weekly.jpg

Skate.
 
@Skate have you changed the formula for the MACD-v ?

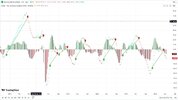
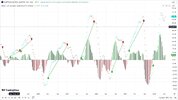
@DaveTrade, I've made some adjustments to the MACD-v code. I've incorporated a unique approach for evaluating volatility, and have also enhanced the visual clarity on the charts. When looking at the charts, the buy and sell signals are clearly displayed, along with a connecting green line, making it very evident whether each signal was a winner or a loser.

It's understandable that newcomers to trading may be eager to get started, yet hesitant to invest in the necessary tools, such as a data and charting package. In my next post, I'll explain why I've chosen to rework the MACD using TradingView, which is a "free" charting program.

Skate.
 
Timing in Trading - A Beginner’s Perspective
As seasoned traders, we often encounter those seeking the elusive “tricks of the trade.” Newcomers, armed with funds are eager to dive into the market, yet uncertain "where to start".

We’ve all heard the adage
“Buy good companies.” But here’s the catch, "timing matters". Purchasing a solid company at the wrong time can lead to a painful experience.

Trading, in theory, seems straightforward
"Buy low, Sell high" is great in theory, but no one ever explains how to do it successfully as the practical application is far from straightforward. The concept of purchasing a position and hoping to offload it to someone else at a higher price "sometime in the future" is challenging to execute as well.

This Sentiment Never Gets Old
It's a common occurrence that those eager to start trading often do so with money they simply "can't afford to lose." Trading with these funds not only heightens the inherent risk but also amplifies the emotional stress involved, making each trading decision feel like it carries the weight of the world on their shoulders.

Skate.
 
So, how does one step into the market wisely?
Allow me to reiterate a previous suggestion, buy all the companies in the ASX20. Next, divide your trading funds into 20 equal dollar amounts and buy every company within the ASX20 index.

But what if they want to trade?
Fear not, use a signal generator or a charting program that displays entry and exit points. For safety, I recommend focusing on the top twenty positions, as a starting point.

And here’s where "TradingView" shines
Whether you use the classic MACD indicator or any of its variants, traders will find it easy to understand this indicator. Initially, the specific MACD version selected matters less as they all reveal those critical entry and exit points (it is like singing along to the bouncing ball). As their skills evolve, they’ll recognise that their chosen indicator will significantly impact their returns. Meaning they will be learning on the job. Pain has a way of focusing everyone on the job at hand.

Skate.
 
Trading Simplified - No Expertise Needed
Navigating the market can be straightforward with a visual chart that clearly signals when to buy and sell. By allocating your trading funds into equal portions, the process becomes more manageable. This approach demystifies trading, offering a fundamental yet effective entry point into the world of trading. By focusing on the top 20 listed companies on the ASX, you’re entrusting your capital to seasoned managers whose primary goal is to enhance shareholder value. That’s the essence of trading, distilled into its most accessible form.

Just follow the signals
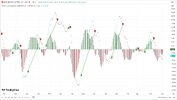
Simply purchase when you see the "green signal" and "sell at the red" ones. The connecting green line illustrates the strategy’s performance at a glance. Engaging in trades by following the yellow dots is an uncomplicated method to kickstart anyone’s trading journey.

Practical Examples (Weekly Charts)
Everything generated below has been done "free of charge" and the results aren't too shabby.

BHP - WEEKLY CHART.jpg


CBA - WEEKLY CHART.jpg


RIO TINTO
RIO Tinto’s Weekly Signals indicate a "current active trade" indicated by the "Green up box" - the joining green line is added when the trade is completed.

RIO - WEEKLY CHART.jpg


TLS - WEEKLY CHART.jpg


Transurban - WEEKLY CHART.jpg


WISETECH GLOBAL
Wisetech Global Weekly Signals indicate a "current active trade" indicated by the "Green up box" - the joining green line is added when the trade is completed.

Wisetech - WEEKLY CHART.jpg

Skate
 
Last edited:
@peter2, building upon Alex Spiroglou’s work, I’ve refined the MACD-v indicator by adding advanced customisation features similar to Amibroker’s "param" functions. This enhancement not only rectifies the original MACD-v constraints but offers a suite of customisation options, including a unique volatility calculation method, addressing the original indicator's limitations. Also, the refined version of the enhanced MACD-v Indicator acts like a smart assistant simplifying the decision-making process. Notably, the advanced version of the MACD-v Indicator maintains consistent performance across different time periods, making it a versatile tool for any trader.

RIO Tinto Daily Chart
RIO Tinto’s Daily Signals indicate an active trade position.

View attachment 177376


RIO Tinto Weekly Chart
RIO Tinto’s Weekly Signals indicate an active trade position also.

View attachment 177378

Skate.
@Skate don't you think that it would be better to have buy & sell indicators on the price chart rather than on the indicator. Some of the trade graphics that look like wins on the indicator are actually losses on the price chart. If they were on the price chart it would be easier to see the effectiveness of the signals.
 
@Skate don't you think that it would be better to have buy & sell indicators on the price chart rather than on the indicator. Some of the trade graphics that look like wins on the indicator are actually losses on the price chart. If they were on the price chart it would be easier to see the effectiveness of the signals.

@DaveTrade, my initial MACD trading strategy was designed with that intent (Top Price Chart). To capitalise on the visual appeal of the indicator, I opted to present only the indicator, signals, and a green line connecting the buy and sell points marked by “yellow dots.” Ultimately, it boils down to individual preference.

Personalising Data Interpretation
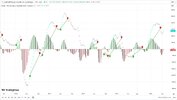
After refining the MACD-v code with a novel volatility assessment technique, I’ve honed the signals to be sharper, significantly reducing false breakouts and boosting returns beyond the conventional MACD strategy. Observing the chart below, one can easily discern the buy and sell signals, underscored by a connecting green line. The screen capture allows for immediate comparison of strategies, rendering backtesting almost superfluous.

Wisetech DUAL CHART - WEEKLY CHART.jpg

Skate.
 
We’ve all heard the adage
“Buy good companies.” But here’s the catch, "timing matters". Purchasing a solid company at the wrong time can lead to a painful experience.
that can be common with investing as well

take my investment in ALQ for example it trended down for three years and if i hadn't 'averaged down' during that time my initial entry @ $8.71 would make my outcome look rather ordinary after 12 years
 
that can be common with investing as well

take my investment in ALQ for example it trended down for three years and if i hadn't 'averaged down' during that time my initial entry @ $8.71 would make my outcome look rather ordinary after 12 years

@divs4ever, with the benefit of hindsight, I now recognise the tremendous potential I may have unlocked had I embarked on this trading journey two decades earlier.

Skate.
 
@divs4ever, with the benefit of hindsight, I now recognise the tremendous potential I may have unlocked had I embarked on this trading journey two decades earlier.

Skate.
luckily i realized quickly that some investments need watching and multiple decisions and not just the small caps.

( stocks like BHP , ILU and several 'national icons ' WOW )

decisions like when/if the add more ( or reduce) and when to just walk away ( even at pathetic profit )

and hindsight that lets you know when you are clever or just lucky/unlucky

and trading is even harder as that cash ( profit ) is needed to pay the bills not fund a lifestyle in say thirty years time
 
Weighing Investment Options
After reviewing our investment options, my wife posed an interesting question. "If we were to invest $2 million, split equally across the top 20 listed companies on the ASX (investing $100,000 in each), how would that compare to the performance of the 5 companies currently in our investment portfolio?" - Let's break down the results.

Option 1: (20) x $100,000 invested in each ASX20 listed company
Capital Gain: $264,810
Dividends: $79,933
Total Return on Investment: $344,743

Option 2: (5) x $400,000 invested in 5 positions within the ASX20
Capital Gain: $163,485
Dividends: $131,484
Total Return on Investment: $294,969

Comparing the two options
Option 1 provides an increased total return of $49,774 over Option 2. The higher capital gains of Option 1 outperform the higher dividends of Option 2.

However, my wife noted that as we are currently in retirement at age 70, the increased dividend income of Option 2 would better suit our lifestyle needs and provide more reliable cash flow. The trade-off of slightly lower total returns is worth the benefit of the higher dividend payments and associated franking credits (that are not included).

Given our stage of life, my wife expressed a preference for Option 2, saying "I would be prepared to forgo the $49,774 in capital gains to receive the extra $51,551 in dividends. The increase in dividends would provide a better lifestyle, so let's stick with our current portfolio of 5 holdings."


ASX20 - 2m + Dividends.jpg


ASX5 - 2m + Dividends.jpg

Skate.
 
#1. Logo.jpg
A Real-life Investment Strategy
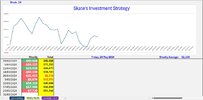
The objective of this 12-month real live experiment is to explore the feasibility of deriving a sustainable income from a portfolio of five investments, based on three key principles: (1) Dividends, (2) Franking Credits, and long-term (3) Capital Gains.

After 24 weeks of this experiment
# Strategy Progress = $125,359
# Dividends and Franking credits = $74,115
# Capital Gains = $51,244
# Weekly Average = $2,135

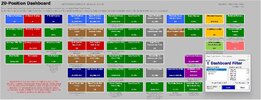
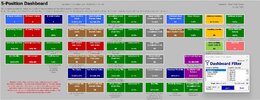
2. Dashboard.jpg


3. Weekly Result Week 12.jpg


Skate.
 
View attachment 177511
A Real-life Investment Strategy
The objective of this 12-month real live experiment is to explore the feasibility of deriving a sustainable income from a portfolio of five investments, based on three key principles: (1) Dividends, (2) Franking Credits, and long-term (3) Capital Gains.

After 24 weeks of this experiment
# Strategy Progress = $125,359
# Dividends and Franking credits = $74,115
# Capital Gains = $51,244
# Weekly Average = $2,135

View attachment 177512


View attachment 177513


Skate.
going to be interesting to see where your next wave of divs. get parked

cheers
 
going to be interesting to see where your next wave of divs. get parked

cheers

Back in March 2024 - I made this post

However, starting from the 1st of July 2024, which marks the beginning of the new financial year, my approach will shift. At that point, I plan to use the dividends and franking credits from my investments to generate a sustainable income.

@divs4ever, commencing with the new financial year on July 1st, 2024, I’ll be adopting a different strategy. The dividends and franking credits from my portfolio will be channelled towards creating a reliable income stream.

Skate.
 
Top