Australian (ASX) Stock Market Forum

Dump it Here

Skate,

Are your backtest results posted in the last several dozen posts baesd upon "point-in-time" constituents, or "current-constituents-at-the-time-of-posting projected to prior periods"?
 
Norgate Data does do not sell, or provide, lists of historical index constituents on a date-wise point-in-time basis.

@Richard Dale, my "Silver Subscription" from Norgate Data doesn’t explicitly mention “point-in-time” constituents. Instead, it appears to focus on the current constituents at the time of posting. Traders should be aware of this distinction and consider its implications when using historical data for backtesting.

I anticipate that Richard will explain the pitfalls of relying on backtest results using Norgate’s “Silver” subscription-level data, which can mislead if not handled correctly. The Platinum Level subscription removes survivorship bias and look-ahead bias, ensuring more accurate backtesting results.

Footnote
As my Norgate Data subscription ends in 3 days, this will be the last set of backtests I’ll be posting.

Skate.
 
Skate,

Are your backtest results posted in the last several dozen posts baesd upon "point-in-time" constituents, or "current-constituents-at-the-time-of-posting projected to prior periods"?

@Richard Dale's post sheds light on the limitations of Norgate's paid data subscription levels, specifically Silver and Gold. It's important to recognise that the quality of backtests relies on the accuracy of the data and the underlying assumptions. If inadequate or incorrect data is utilised, the resulting backtest results can be misleading, as Richard astutely points out. It serves as a reminder that the quality of data is crucial to obtaining reliable and informative backtest outcomes.

Skate.
 
Thinking of Using Norgate Data? Beware of the Pitfalls for New Traders
If you're a new trader seeking to backtest trading strategies, you may have come across Norgate Data as a provider of historical stock market data. While Norgate data is a valuable resource, new traders must exercise caution when relying too heavily on results obtained from their entry-level data subscriptions.

Norgate offers tiered subscriptions for Australian stock data, with the "Silver" subscription being the most affordable option. However, it's important to recognise that this subscription only provides the last 10 years of data for "currently listed companies". While this may seem like a cost-effective way to conduct backtesting, it's essential to understand the limitations and potential pitfalls associated with this limited dataset. With their subscription models, it's a trade-off between cost savings and data integrity.

Skate.
 
Skate,

Firstly, let's talk about "bad science". In academic circles, bad science refers to false and misleading claims:

Instead of describing data set/capabilities without survivorship bias being "more accurate", it is simply "accurate".

Using a data set with survivorship bias/pre-inclusion bias for backtesting an algorithmic trading system is inaccurate, and will result in false and misleading conclusions.

Cesar Alvarez did a nice write-up on this:

He specifically talks about pre-inclusion bias.

Pre-inclusion bias is using today’s index constituents as your trading universe and assuming these stocks were always in the index during your testing period. For example if one were testing back to 2004, GOOG did not enter the S&P500 index until early 2006 at a price of $390. But your testing could potentially trade GOOG during the huge rise from $100 to $300.

People often write about systems they have developed using the current Nasdaq 100 or S&P500 stocks and have tested back for 5 to 10 years. Looking at this table shows that one should completely ignore those results. The difference between the two results is scary. Using the current list would make one think that they had a great system but actuality it was much worse.

On a basic momentum system that uses stocks within the S&P 500, his returns went from 30.57% on the "current" constituents only down to 7.90% using the correct/accurate point-in-time/historical index constituents.

A variant of the system that incorporates a marker trend filter, the returns went from 36.25% on the "current" constituents down to 14.07% using the correct/accurate point-in-time/historical index constituents. The max drawdown also increased from 24.54% to 30.42%.

So, all of your multi-year backtests that have used the "current" constituents are flawed. Other backtests that use only a small recent data set are also flawed (small sample size, recency bias, selection bias to name a few issues).

You need the right tools, the right data and the right approach to have any level of confidence that the backtest is showing you something statistically significant. Anything else is just "bad science."

If you really want to help the community, post your formulas instead so others can backtest them with the right data and approach, if you're unable/unwilling to do so.
 
So, all of your multi-year backtests that have used the "current" constituents are flawed. Other backtests that use only a small recent data set are also flawed (small sample size, recency bias, selection bias to name a few issues). Using a data set with survivorship bias/pre-inclusion bias for backtesting an algorithmic trading system is inaccurate, and will result in false and misleading conclusions.

@Richard Dale, you’re absolutely correct that survivorship bias, pre-inclusion bias, small sample size, recency bias, and selection bias can all affect the accuracy and reliability of backtest results. Although flawed backtests may not yield perfect or definitive conclusions, they can still offer valuable insights.

Skate.
 
I've made a switch to the dark side
My decision was a snap decision yesterday, but I had been thinking about the switch for a while.

In the upcoming posts
I’ll gradually discuss a project that is nearing its conclusion. However, I’ll delve into the details later.

Navigating Trading: From Active Trader to Investor
First and foremost, I want to express how trading has significantly contributed to my financial well-being over the years, even though I approached trading as a hobby. Initially, I set out with the modest goal of achieving a 6% return. Fortunately, I experienced early success and never looked back.

My first setback
However, there were a few setbacks along the way, notably a loss of 19% of my open profits by the end of the calendar year of 2018, which was a significant blow at the time and had a profound impact on my morale. This was the first time I encountered a setback of this magnitude.

Skate.
 
Pain has a way of focusing your thinking
The experience of my first setback prompted me to reassess my trading strategy, with a focus on refining my exit strategy, ultimately leading to the development of a "Get-The-Fund-Out" (GTFO) exit strategy. This, in turn, resulted in the adoption of my "Stale Stop" approach, where I made a deliberate decision not to remain in a position that was yielding minimal returns or going sideways, as I believed my funds could be better invested elsewhere.

Skate.
 
My second setback
The emergence of the COVID-19 pandemic posed another significant challenge, but the presence of my "GTFO" and "Stale Stop" exit strategy provided relief amidst these difficult times. Throughout this period, I took advantage of the additional time to contemplate the significance of "market timing," realising that effectively "timing the market" was crucial in mitigating my risk, ultimately resulting in an enhancement of my returns.

Skate.
 
In pursuit of a passive income
I made a snap decision after much contemplation. Reflecting on the evolution of my original goal to achieve a 6% annual return, I realised that what had started as a mere hobby had transformed into a consuming passion. Consequently, I made the deliberate choice to take a break from active trading and transition into an investor role.

Skate.
 
Transition to investing
Despite transitioning to an investor role, I remained actively involved in the market by developing a reasonably effective "Trend Momentum Strategy" for paper trading. Committing to a 12-month investment period provided an ideal timeframe for testing the strategy.

Strategy Progress from January 2024
Since the 1st of January, 2024, the "Trend Momentum Strategy" experienced a slow start due to its stringent buy conditions, resulting in the first signal being generated in early February and the last signal in April. With the strategy currently in cash and my Norgate Data subscription expired, this presents an opportune moment to evaluate and share the progress of this strategy. If the strategy performs as expected, it will be integrated into my portfolio of trading strategies, marking the successful completion of the investment exercise.

Skate.
 
Reflecting on the Transition
It's only been 5 months since I transitioned from an active trader to an investor, and it has been a remarkable journey marked by both challenges and opportunities. This shift has allowed me to reflect on the evolving nature of my relationship with trading and investing. While investing can sometimes feel like watching paint dry, I do find myself missing the active involvement in the markets.

Skate.
 
Although flawed backtests may not yield perfect or definitive conclusions, they can still offer valuable insights.

The Trend Momentum Strategy
The purpose of today's series of posts is to shed light on the process of developing a new strategy after being actively involved in system trading. The "Trend Momentum Strategy" was crafted using Norgate's lowest-level subscription, which offers the last 10 years of data for "currently listed companies." For those embarking on this journey, Norgate's "Platinum" data subscription is indispensable to mitigate survivorship bias, ensuring the accuracy and reliability of backtest results.

The Evolution of Strategy Production
While backtesting marks the initial phase of the strategy production process, paper trading the "Trend Momentum Strategy" has shown promising early results. Although this calendar year has seen its share of challenges, the strategy has demonstrated resilience due to its stringent entry conditions and refined exit strategy.

Skate.
 
Evaluating Paper Trading Results
The paper trading results cover the period from the 1st of January 2024 to the present date. However, it's crucial to acknowledge that the majority of the returns were realized during February and March, which has somewhat skewed the ongoing results. While it's premature to draw a definitive conclusion, the strategy seems to be performing in line with expectations. The unavailability of Norgate data has abruptly halted the paper trading process.

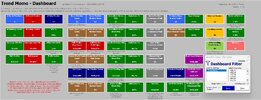
The "Trend Momentum Strategy" Dashboard
Provides a condensed, easily digestible overview of the returns.

Trend Momo Dashboard.jpg


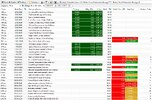
Buy Trades.jpg


Sold Trades.jpg

Unveiling Signal Origins in System Trading
In the upcoming posts, I'll illustrate the origins of my signals in system trading.

Skate.
 
Clarifying the Nature of Today's Posts
The content shared today does not represent a backtest, but rather it constitutes a paper trading exercise. It showcases the hypothetical trading results that would have been achieved if the system had been diligently followed, with signals generated weekly at the end of trade on Friday afternoon for market entry over the weekend.

Simplifying the Metric
In paper trading, I adhere to a consistent format to facilitate easy visualisation and mental manipulation of the results, regardless of the outcome. Each portfolio commences with $100k, allocated across 10 equal positions of $10k each. The code nested within my strategy not only determines the buy and sell decisions but also tightly controls conditional entry, which is of paramount importance.

Utilising the Exploration Feature of Amibroker
By leveraging the Exploration feature of Amibroker, I can manipulate information to enable trading in the pre-auction without exceeding my investment limit of $10k per position. Under these conditions, trading simply involves following the instructions displayed of what to buy, the number of shares to purchase, and a re-calculated offer to secure the opening price.

Exploration Signals
The graphic presents condensed exploration signals derived from a larger sub-set. To enhance clarity, I have carefully selected and organised specific signals from the original sub-set. These selected signals are highlighted using red and blue rectangle boxes, allowing interested individuals to easily follow along.

Exploration Condensed Signals.jpg


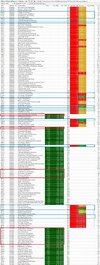
The full Exploration analysis
Comprises a comprehensive collection of raw signals generated by this strategy, going beyond the 10-position portfolio. The "date generated" report represents all the signals produced, which are then prioritised by ranking. In the graphic, the positions taken are highlighted in "red boxes", while the corresponding "blue boxes" indicate the selling points for these positions. This colour-coded representation aids in visualising the entry and exit points for each position.

Exploration Signals 1.jpg

Skate.
 
Interpret the exit type by colours
The three highlighted exit comments provide valuable insights into the performance of the strategy. While every position in trading results in either a loss or a profit, the manner in which positions are exited conveys a more significant story. The exit types are represented by different colours, each carrying a distinct meaning.

The coloured exit tells a powerful story
A red box indicates a "Trailing Stop" exit and a gold box represents a "Stale Stop" exit, which suggests that the position is no longer performing as expected but is not as unfavourable as a red box. A green box signifies an exit from a "Take Profit Stop," which is the optimal outcome. Ideally, fewer red boxes are preferred, and the presence of gold "Stale Stops" indicates that the strategy is persevering. However, it is the green boxes that traders eagerly anticipate, as they signify successful profit-taking opportunities.

Skate.
 
Visualisation of the charts
The price chart has been designed to ensure optimal readability, with all relevant information clearly displayed. By presenting this information, you can effectively assess the progress of a company based solely on what is shown in the chart. Its design has been carefully crafted to facilitate easy comprehension, making it readily understandable for others as well.

The Price chart
In order to provide further clarity on the concepts discussed, I have specifically chosen two charts to highlight the progress of the top and bottom performers in the "Trend Momentum" portfolio. The chart representing the best performer, (OBM), and the chart representing the worst performer, (DYL), are presented below to visually depict the movement generated by the exploration analysis. These charts offer a clear representation of how these signals have evolved.

Sold Trades.jpg

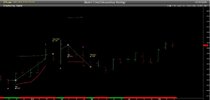
The price chart for (OBM) - best performer
The price chart for (OBM) - the best performer, showcases two signals, but only the one on the right is relevant to this paper trading exercise. It's important to note that both signals resulted in a winning move. The signal bar is represented by a white open "up" arrow, indicating a potential entry point.

The buy bar is depicted as a white open box, signifying the actual purchase of the position. A yellow down arrow represents a "Stale Stop," indicating that the position has lost momentum or is not performing as expected. The red line positioned below the price bars represents the "Trailing Stop," which serves as a dynamic exit strategy.

The dashed line positioned above the price bars serves as the "Take Profit Stop" indicator, providing a target for profit-taking. A solid green arrow represents a "Take Profit Signal," indicating an optimal point to exit the position. The corresponding exit bar is represented by a yellow open circle. These visual elements help to interpret the movements and outcomes of the exploration signals on the price chart.

OBM.jpg


The price chart for (DYL) - the worst performer
The price chart for (DYL) - the worst performer, reveals two moves, but only the one within the paper trading date range is relevant. Regrettably, this particular move did not meet expectations and resulted in a loss. However, the previous move demonstrated a successful trend prediction, indicating the strategy's capability to identify favourable trends.

It's important to note that whether a move results in a loss is not necessarily a fault of the strategy but rather influenced by the sentiment of the market, which can be challenging to anticipate in advance.


DYL.jpg


Skate.
 
Information overload
Today's series of posts emphasises the simplicity and effectiveness of systematic trading. Once a strategy has been carefully developed and proven to perform well across various market conditions, it instils confidence in following the generated signals. All the information presented today relied on Norgate data, Amibroker and Share Trade Tracker.

@Richard Dale has made numerous posts about backtesting using the "Platinum" level of subscription so that survivorship bias doesn't affect the accuracy and reliability of backtest results. In my defence, flawed backtests may not yield perfect or definitive conclusions, but they can still offer valuable insights.

At some point, we all need guidance when trading
Traders value clear guidance on what to buy when to buy, and when to sell, which is precisely what a robust trading system offers. Additionally, including the offer price in the pre-auction, along with the recommended number of shares to purchase, helps prevent overinvestment, providing an additional advantage for traders.

This style of trading has proven to be successful for me over many years
Mechanical system trading involves consistently applying a repetitive approach, where there are both winning and losing trades. However, the key is ensuring the winning trades outweigh the losing ones. This principle aligns with one of @Nick Radge's core beliefs, which emphasises that "Successful trading = a simple strategy applied for the long term." By adhering to this mantra, I have been able to achieve positive results and maintain a profitable trading approach throughout my trading journey.

Radge.jpg

This should bring my trading posts to a close
When you have no data "strategy development" comes to an end.

Skate.
 
Last edited:
#1. Logo.jpg
A Real-life Investment Strategy
The objective of this 12-month real live experiment is to explore the feasibility of deriving a sustainable income from a portfolio of five investments, based on three key principles: (1) Dividends, (2) Franking Credits, and long-term (3) Capital Gains.

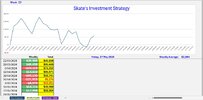
After 23 weeks of this experiment
# Strategy Progress = $133,079
# Dividends and Franking credits = $74,115
# Capital Gains = $58,964
# Weekly Average = $2,564

2. Dashboard.jpg


3. Weekly Result Week 12.jpg

Skate.
 
Top