- Joined
- 28 December 2013
- Posts
- 6,392
- Reactions
- 24,319
Ann,
Great analysis. Not only are traders watching the 200MA, but investors.
Using a "Moving Average" to trade
I was reading the notes of an institutional trader remarking that average daily volume is the single biggest factor in scanning for signals. The next is daily volume. Their main objective is to move large amounts in & out of the markets without shifting the price.
This got me thinking, how do they actually do it?
They scan using a simple formula (the moving average over the last 5 periods) multiply by (the moving average of the volume of the last 21-periods) then filter the results by momentum.
Nah, it couldn't be that simple
Well, you live & learn. Fancy the big guys moving large sums with something so crude. This got me thinking, would it be effective to trade such a beast. Two lines of simple code & I'm up & running. There was no mention that they used other filters or parameters so to give the idea a fighting chance I've added a few filters of my own.
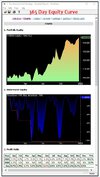
365 day backtest
Not too shabby of a trading strategy on face value.
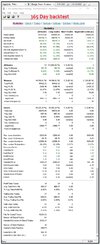
365 Day Equity Curve
So far so good

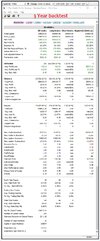
3 year backtest
Turn over the belly of the beast & it reveals a dark side.
3 Year Equity Curve
I'll give this strategy the flick as it would require additional work. The basic premise couldn't handle COVID & there were a few months that had larger drawdowns than I could tolerate.
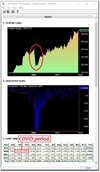
Summary
In my opinion, this simple idea might work for the institutional trader but it's not for me.
Skate.

