Australian (ASX) Stock Market Forum

Dump it Here

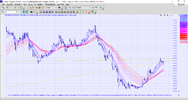
Sorry Skate, I hope you don't mind me littering your thread but just to make it clear for everyone to see how I draw my short term trendlines (all trendlines actually) I do it on end-of-day prices so I can really get fine precision to really know when a price has moved out of a support line. This is the same 4-month daily chart only now drawn with EOD.
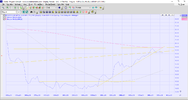
FMG EOD 2.1.22.png
 
I hope I am not appearing argumentative, I am not attacking Skate or his system just offering an alternate view if anyone has the interest and energy to learn to chart.

Sorry Skate, I hope you don't mind me littering your thread but just to make it clear for everyone to see how I draw my short term trendlines (all trendlines actually) I do it on end-of-day prices so I can really get fine precision to really know when a price has moved out of a support line. This is the same 4-month daily chart only now drawn with EOD.

An alternative point of view
No, to the contrary, you are not littering up this thread & you have certainly not been argumentative at all. "Alternative views" are welcomed with open arms. I just hope others study your charts as I do. There are some gems to be found in your charts.

Charts
I post charts to demonstrate the message I'm trying to get across as a few charts help me explain the point a little better as a "picture paints a thousand words".

# Visuals that back up a point of view are priceless.

Skate.
 
What a year DOH Mistake.jpg

Most losses are not the result of a poor plan, but of failure to follow it
Trading is a very emotional experience & emotions can sometimes sabotage the best of plans, even when trading is traveling nicely it’s difficult to follow the plan.

The nature of the trading game
I've been reading the recent comments with interest. It's a perfect time to remember that trading is not always a bed of roses, losing days/weeks & even a few losing years are inevitable. Even after you have learned to trade successfully, you will still take your hits. It's pleasing to read the end-of-year posts of others as it gives you a benchmark to compare your recent performance.

Skate.
 
Staying disciplined & focused in 2022
At this time of the year, we tend to do a bit of soul searching to establish if we could have done better. We like to think that our results are a direct consequence of our insight & efforts, but the reality is our results are at the mercy of the markets. Pure & simple, good traders are calculated risk-takers.

You should continually seek further knowledge
You can read almost any trading book or a series of posts on this forum to discover the gems. Yet most people fail to follow them. Write down anything that you read on this forum that gels or otherwise you’ll forget. Your trading ability comes from within by executing your trading plan consistently with confidence.

We need discipline
Discipline will be required in 2022 to face the challenges that may present over the coming months. Being disciplined lets you better cope when the unexpected happens in difficult trading times.

Skate.
 
At this time of the year, we tend to do a bit of soul searching to establish if we could have done better.

The old saying “you don’t go broke by taking profits” is utterly wrong for a trend follower
Trend followers need to fight the temptation of grabbing quick profits by cutting winners early instead of letting them run. This means traders need to accept giving up large profits before the trend resumes, or you'll get stopped out again & again. The real bummer is that trend trading has a win ratio lower than 50%.

Trend Trading is not a free lunch
Trend following might look easy in backtests, but it’s far from easy to trade the system flawlessly without behavioural mistakes. At first, you take on a position & it slowly heads your way, until it suddenly reverses & heads down finding yourself being constantly stopped feeling like a "death by a thousand cuts". This means most trades will end up as losses. In reality, most traders have a hard time tolerating such a system as "trend trading" is not for everyone.

Skate.
 
Last edited:
It’s tough to be a trend follower
The truth is, most traders give up or don’t take the next signal after a series of losses & have trouble pulling the trigger after a multitude of losing trades in a row. The main advantage of trading a trend trading strategy is simplicity, jumping on & off trends. Trading this way doesn’t require a lot of time to manage & works best on longer time frames.

Behavioural mistakes
Your success in the markets is ultimately less about your strategies (your entries & exits), but more about your behaviour. Being human means we all make behavioural mistakes that impact our returns. If you have a tendency to override your strategy you're probably better off spending less time following the markets by trading a monthly strategy.

Skate.
 
It’s tough to be a trend follower
The truth is, most traders give up or don’t take the next signal after a series of losses & have trouble pulling the trigger after a multitude of losing trades in a row. The main advantage of trading a trend trading strategy is simplicity, jumping on & off trends. Trading this way doesn’t require a lot of time to manage & works best on longer time frames.
I like trend trading, that is why I rely very heavily on the 200dsma. If the 200dsma is moving upward and the price of a stock has moved above the 200dsma, but not too far above, of course, just a wee bit as this is where mistakes can be made if the price is too far above the 200dsma as it could fall back to re-test the 200dsma. If you see your stock falling by 20%-50% as it re-tests the 200dsma, it can take serious balls to stay in the trade. Then given you didn't buy in too far above the 200dsma, just hang out in that stock until it falls below the 200dsma again, there you have your auto buy and sell trigger. If it is travelling sideways then don't enter until the 200dsma line starts to curve up again. No drama, no stress, very time economical, very easy signal in and out with minimal trading. That is how I traded for years when I was working and bringing up kids and very time-poor. It works really well and I rarely had a stock that lost money.

If a shorter time frame for trading is desired then work with the 50dsma in the same manner, again, easy, stress-free and minimal trading required.

You can mix and match as well. Get in once the 200dsma is curving up and just under the price and get out when it has been rising for a while when it falls below the 50dsma, sell. If it then rises above the 50dsma again, you could re-enter, wash rinse repeat. However, there is a lot more trading associated with this but more upside profits can be had.

Again, not taking a shot at Skate or his system, just offering some thoughts from a 20year charting veteran.
 
What is a Moving Average?
A moving average is a technical indicator to determine the direction of a trend & is a popular indicator with many variations. As a simple moving average (SMA) is in the discussion I'll concentrate & confine my comments to this one alone. My all-time favourite moving average is John Ehlers - "Deviation-Scaled Moving Average" (DSMA) that I may post about after clearing up a few misconceptions of the use of moving averages in trading.

The SMA is not so simple to trade
The SMA might be simple to calculate but isn’t as simple to trade. But I'm first to admit it's the most popular of all indicators in trading. But like most indicators, it isn’t a cure-all for trading. Choosing the right moving averages adds reliability to all technically-based strategies but is best confined as an indicator, rather than a signal generator.

Skate.
 
The SMA as an indicator
Moving averages basically calculate the average price of a certain number of periods to smooth out the price action with a visual representation of the overall directional movement. Moving averages can be used to generate trading signals but not so much with trend trading as the lag of the indicators is the killer.

Moving averages are known to be lagging indicators
All moving averages lag behind movements in price. A faster MA has less lag when compared to a slower MA. Moving averages also work well as filters & it's primarily used in Index Filters & buy filters.

Summary
Far too many traders have tried to use the simple moving average for "Buy & Sell" signals. There are some traders who might be able to pull this off using "multiple moving averages" for the trigger, such as "Guppy's Moving Averages" but on average it rarely works as expected. To that point, save yourself some time & heartache & just stick with using "moving averages" to determine the strength of the move, & restrict using them to generate "buy & Sell" signals.

Skate.
 
DSMA is a useful moving average
Deviation Scaled Moving Average (DSMA) is more than a useful moving average. John Ehlers "Deviation-Scaled Moving Average" (DSMA) is an adaptive moving average that features rapid adaptation to volatility in price movement.

Moving averages have two characteristics
They lag and they smooth data. But there are different ways to tweak them. DSMA is one way to make them more adaptive to current prices & make the smoothing heavier. It accomplishes this adaptation by modifying an EMA if the standard deviations from the mean.

The DSMA’s responsiveness can be changed

Ehlers, Deviation Scaled Moving Average (DSMA) is best suited for trend-following systems as it uses a data smoothing technique that acts as an exponential moving average with a dynamic smoothing coefficient. The smoothing coefficient is automatically updated based on the magnitude of price changes quickly adapting to these changes.

Summary

Forget about using a simple moving average (SMA) & go directly for the big gun as the DSMA’s responsiveness runs rings around all other types of moving averages, hands down.

Skate.
 
Guppy's Multiple Moving Averages
As trend trading strategies go, using "Guppy's Multiple Moving Averages" would be a suitable choice as it's easy to follow & understand. The relationship between the 12 exponential moving average (EMA) tells the story of long & short-term buyers.

The Guppy Multiple Moving Average (GMMA) indicators
This nifty homegrown lagging indicator provides an exciting approach using 12 (EMA). The Guppy Multiple Moving Averages is a great tool if you are considering building a trend-following system. The (GMMA), is a fine technical indicator that identifies the strength & changes in trends. The changes in the trend are indicated by the GMMA ribbon. The combined (EMA) ribbon times the "entry & exit" & as a signal goes it's more than useful in timing when to get in & out of a trade.

Summary
There are multiple uses for moving averages in trading systems but there is some trickery to be done to achieve good results.

Skate.
 
Cracking the GMMA indicator
As a trend trader, it’s just not enough to identify a confirmed trend. Timing the entry (when to jump into a trend) is so important. The Guppy's (GMMA) Indicator allows you to get into a trend as soon as possible & to get out after a trend has reversed.

More information is found here

Skate.
 
DSMA
The idea & the mathematics behind "Ehlers DSMA" is not new. Ehlers has a habit of twisting his earlier ideas & making them new again. Also, Ehlers DSMA indicator modifies the alpha term of an "EMA" whereas Tushar Chande, uses the RSI to adjust the alpha term to achieve similar results. Perry Kaufman, on the other hand, uses his "Effectiveness Ratio" to adjust the alpha term - meaning they all achieve similar outcomes using different indicators & methods. Why mention this? - For others to understand the logic behind the idea which is sound, solid & effective (to a point - I might stress)

DSMA Indicator
I have a competitive trading system built around Ehlers DSMA indicator & performance is respectable. John Ehlers “A Peek into the Future” filter isn't new as I've had the filter in the "to do" basket since 2019. As there is less chatter in the "Dump it here" thread it was the perfect time to make a post about John Ehlers & his indicators. Up until yesterday, his "Voss Filter" was collecting dust. I now believe I should give it the same respect as I've given his DSMA Indicator.

For those technically minded - read more about the DSMA indicator here
https://www.mesasoftware.com/papers/DEVIATION SCALED MOVING AVERAGE.pdf

The DSMA Strategy is a solid performer
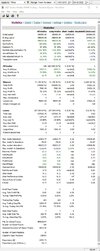
The Backtest period below is from 1/1/2016 to the end of trade 31/12/202. The issue with trading "Ehlers DSMA" is the exposure is low but in fairness, the drawdown is also low.

5 Year DSMA Top.jpg


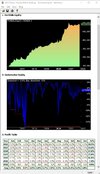
The DSMA (5 Year) Equity Curve
The COVID flash crash was handled without any major issues but with all trend-following systems, 2021 had its moments struggling to achieve traction during the year.

DSMA Equity.jpg


Summary
The DSMA strategy sits nicely within my stable of strategies.

Skate.
 
Summary
Forget about using a simple moving average (SMA) & go directly for the big gun as the DSMA’s responsiveness runs rings around all other types of moving averages, hands down.
@Skate I think that some may take your statement the wrong way. An indicator is what it is and if a person requires a particular functionality that is provided by an SMA then that indicator is extremely useful to them.
 
@Skate 's posts are always read with interest.

You said it yourself, the start of trends can only be identified in hindsight. All attempts to identify them at the time will be an exercise in probability. We may be correct at the time or we may not.

All your back tests have conclusively shown that it doesn't matter if we can't identify the exact start of the trend. If we manage the exits well we can create a positive edge. This is the most important aspect of a profitable trading system.

I read & analyse many posts
At times I'm looking for the hidden gems that most including the poster are unaware of. When you know something you mistakenly believe everyone else knows it as well. I've posted charts & backtests to explain my point of view confirming the ideas have legs as a trading system.

I have a habit of losing interest quickly
I'll develop a trading system & once it's been through the wringer I'll trade it. Without puffing, they seem to perform as expected. In the background, I have strategies at various stages of development. Even if a strategy is performing I'll turf it to try something different. The Platinum & Flying Bat Strategies are my latest two to have a crack at the big time & by-the-way, I'm expecting great things from these two.

It's all about timing the exit
@peter2 remarked that it doesn't matter if we can't identify the exact start of the trend. If we manage the exits well we can create a positive edge. Well, Peter has a knack of succinctly nailing a point. The point Peter made is exactly the philosophy I employ in all my strategies.

Skate.
 
@Skate I think that some may take your statement the wrong way. An indicator is what it is and if a person requires a particular functionality that is provided by an SMA then that indicator is extremely useful to them.

@DaveTrade that is not in dispute.

Your post allows me to clarify what I have said about a simple moving average (SMA). The SMA is an extremely useful indicator & I didn't say it wasn't. Cherry-picking one statement out of context is normally unhelpful as it gives the wrong impression of what I've just written.

The SMA as an indicator
Moving averages basically calculate the average price of a certain number of periods to smooth out the price action with a visual representation of the overall directional movement. Moving averages can be used to generate trading signals but not so much with trend trading as the lag of the indicators is the killer.

Moving averages are known to be lagging indicators
All moving averages lag behind movements in price. A faster MA has less lag when compared to a slower MA. Moving averages also work well as filters & it's primarily used in Index Filters & buy filters.

The SMA is not so simple to trade
The SMA might be simple to calculate but isn’t as simple to trade. But I'm first to admit it's the most popular of all indicators in trading. But like most indicators, it isn’t a cure-all for trading. Choosing the right moving averages adds reliability to all technically-based strategies but is best confined as an indicator, rather than a signal generator.

Summary
Far too many traders have tried to use the simple moving average for "Buy & Sell" signals. There are some traders who might be able to pull this off using "multiple moving averages" for the trigger, such as "Guppy's Moving Averages" but on average it rarely works as expected. To that point, save yourself some time & heartache & just stick with using "moving averages" to determine the strength of the move, & restrict using them to generate "buy & Sell" signals.

Skate.
 
The SMA as an indicator
Moving averages basically calculate the average price of a certain number of periods to smooth out the price action with a visual representation of the overall directional movement. Moving averages can be used to generate trading signals but not so much with trend trading as the lag of the indicators is the killer.
No on the contrary Skate, I must disagree, the SMA is not a lag because it is a watched signal/indicator, a trigger for the dozens, hundreds or thousands of traders waiting for an entry indicator/signal/whistle blow/ trigger/gunshot/ whatever you want to call the point where the trader commits his money. Many people try to get very clever with MAs thinking they will get an edge. If you are using a less used MA, you will have a less-used entry/exit point. The best edge anyone can ever have is to know when the majority of traders are going to commit to a trade, that is why I use the 'simple' MA as that is the standard-setting on Stockcharts, the 50dsma and 200dsma. More traders would use Stockcharts than any other chart system around. I want to be right in the thick of the herd so I can get the go signal as it happens.

Another point is when a trader is looking at trading shorter trading periods they don't want their money tied up in a stock going nowhere for any length of time, that may be lost opportunities.

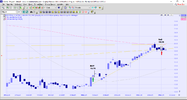
Let's look at your system using your chart for FMG, your entry was September 27th at $15.60 opening price. Then you sold and bought back in at $1 above your exit price. So that is say $40 brokerage and if you have a $10,000 holding let's say 640 shares that's another $640 plus $40 not in your pocket. Then you do a final close on December 24th at $19.60 opening price. That is almost exactly three months in the market with four trades and a miss of around $680 along the way. (My calcs are always open for criticism).

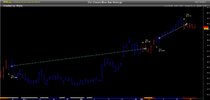
Now let's look at my chart using the SMAs as an entry point November 12th at $15.75 closing price. I then sit in the trade until it fails the 200dsma and a short term rising support line then exit on December 29th at $19.28 closing price. Two trades and a month and a half in the market.

I want to make it very clear to anyone reading this, I am not in a dispute or even in a passive-aggressive argument with Skate, I find this sort of stuff absolutely fascinating to look at different styles of trading and charting. It gives me a chance to think beyond my normal roadways. I am always searching and seeking better ways of trading and honing my skills. I may have been at this for 20 years but will never cease to have a desire to keep learning.

Anyone is welcome to calculate the proceeds from both trades, I am over the figures now! :)

These two charts are adjusted to be identical time frames with each other but with one extra day on the left side of my chart.
FMG buysell 31.1.21.png

Daily FMG.skate.jpg
 
Guppy's Multiple Moving Averages
As trend trading strategies go, using "Guppy's Multiple Moving Averages" would be a suitable choice as it's easy to follow & understand. The relationship between the 12 exponential moving average (EMA) tells the story of long & short-term buyers.
Uurgh, they are just like bloody party streamers all over my charts. I tried them out for about a minute when Colin added them to the indicators list until the untidiness and unnecessary junk got in my way. Pretty but and you can create your own colour scheme, whoohoo!??

FMG guppy.png
 
Having a difference of opinions is healthy
When others post from their perspective it allows others to think more deeply about a subject. The opinions I post are my opinions alone & from my trading experience. When I make a post it's done to help others understand the information slanted from the views I hold. The recent series of posts was to explain that Moving Averages are a great indicator but a tad disappointing using them as a signal generator. I went on to explain "Guppy's Multiple Moving Averages" is the exception but fails to deliver the promised results so widely expressed.

No on the contrary Skate, I must disagree, the SMA is not a lag

Choosing the right moving averages adds reliability to all technically-based strategies but is best confined as an indicator, rather than a signal generator.

EMA is a lagging indicator.

Using lagging indicators is like chasing shadows against a wall.....

Most standard indicators are lagging ones. Doesn't anyone use a leading indicator? The lagging ones like MAs and EMAs are pretty useless IMHO.

All indicators are lagging
All versions of "moving averages" are lagging & that's why I made a post about Ehlers DSMA indicator quoting that his idea to reduce the lag mathematically improves performance. Using the mathematical genius of Ehlers DSMA indicator as a trading strategy the backtest results I posted are respectable.

Skate.
 
Top