Australian (ASX) Stock Market Forum

Dump it Here

After reading the ASIC guidelines I have decided to cease this practice but thanks for the heads up.

Skate.

I am not saying that you do it but isn't that what the pump and dumpers do. Buy XYZ and then tell everyone else to buy and then sell into their liquidity.

Either way I highly doubt that asic reading these posts looking for someone to prosecute. If they are they should probably spend their time elsewhere I would imagine
 
so it appears Nick does not have his own Australian Financial Services Licence but operates under SWM.

Entropy, very interesting detective work but guess no difference to having a licence as far as ASIC is concerned.

After reading the ASIC guidelines I have decided to cease this practice but thanks for the heads up.

Yes, I was thinking the same about providing signals here but think these guidelines are only recent.

Talking about the FFX chart, another one is the impossible 20M equity curve promoted excluding any tax and comparing it against the index.

The compounding effect of paying zero tax would be massive over 25 years.

Not even considering the pitfalls of a 25 year backtest, I wonder if this is something that could be taken as misleading. I doubt it would but that 20M equity is something to behold and suck in newcomers.
 
Thank you for your response investtrader.

I wrote:
"I knew nothing of Nick Radge so Google led me to his site and then to an hour and a half Q&A podcast in a series "Chat With Traders" 178. The Blueprint: How To Create A Simple Trend Following System.
Nick came across as a pleasant personality and I took a few notes as he discussed his methods."

Hardly "piling on". My comments about the podcast were mostly quite positive apart from the one you are upset by!
"Piling on" is a complete exaggeration.
And I took several pages of notes as well as he had some useful things to say.

I gave the location of the interview for anyone else to check the accuracy of my reporting and I listened to it more than once.
Did you actually listen to the podcast?

I stand by my reporting, I did not write "clearly incorrect statements".
You are making reference to something elsewhere Nick Radge may have said whilst I referred to a very specific interview viz 178. The Blueprint: How To Create A Simple Trend Following System which is available online for all to hear hence I reject your assertions.
Thanks for your reply. I didn't listen to the interview and really don't have time to spend on listening.
I have seen how easily criticism can spiral on forums and I was just trying to convey the correct information regarding Nick. Perhaps piling on was too emotive. There are very few traders who trade for real and are profitable and who survive for 25 years or more - Nick is one of them. There is no way he doesn't understand how to build and test a system and the proof is in the doing.
Happy to move on.
Cheers
 
Thanks for posting investtrader!

Brought smiles from me and some fond memories.

This Dozsa character's skit is sending up of course the original Dozsa, the late Paul Dozsa.

Older chessplayers on this forum may remember him as the notorious Hungarian chess master who emigrated to Australia and made a name for himself as a serial pest and freeloader who wanted to get into the Guinness Book of Records as the world's biggest freeloader.
His specialty was to eat and drink at upmarket restaurants then decamp without paying.
Did a few stints in jail for his actions. Had a few stints on television.
Another guy I knew, Frank Lilly, was his manager in negotiations for fees to be interviewed, I kid you not!

I once played chess against him in a tournament at St George Leagues Club in Sydney ( he beat me).
A larger than life, bizarre, character with aristocratic pretensions. He told me that he did military service in Hungary and a chip was implanted in his brain by military intelligence as an explanation of his strange behaviour, he was being manipulated from Budapest!
The actor does a good impersonation of Paul.
@entropy Thanks for the background - very interesting. I just read about it on Wikipedia.

Here's another impromptu interview for a laugh - chick chick boom girl. And it was absolute BS. She made it all up on the spot which is what makes it even funnier.

 
Talking about the FFX chart, another one is the impossible 20M equity curve promoted excluding any tax and comparing it against the index.

The compounding effect of paying zero tax would be massive over 25 years.

Not even considering the pitfalls of a 25 year backtest, I wonder if this is something that could be taken as misleading. I doubt it would but that 20M equity is something to behold and suck in newcomers.

Makes a big difference @Sir Burr, I had a quick look at one of my spreadsheets.
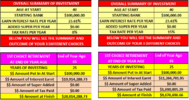
Below is the summary of the 2 different outcomes, without Tax and with Tax.

In a perfect world a 40 year old chap invested $100K for 25 years
1st Box: He got a return each year of 23.61% / he didn't add anything to it each year / and he paid NO TAX!
2nd Box:
Exactly the same conditions BUT he paid 15% TAX each year on his profits.

Screenshot 2022-07-16 123130.png
Tax was only 1.7 Million but his account dropped over $10 Million :eek:.
 
most folks focus on $$ not percentage of portfolio. A $500k drawdown doesn't get any easier to accept just because it might be 10% to 20% of your portfolio. Humans are humans and even Nick R is a retail trader so that's still tough.

Nick's pinned Twitter capture

Pinned tweet.jpg

A drawdown of 20%, yeah, that's acceptable
I've made a series of posts about talking about "percentages" & you quickly become desensitized to its real value. Relating a loss in percentage & converting it to dollars is sobering as your results will take on a new meaning, so don't let percentages fool you into a false sense of security.

Posting anything about "The Chartist" sprukes interest

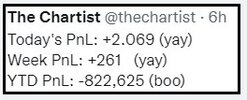
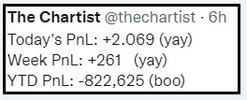
Early in January this year, Nick decided to post his dollar Profit & Loss (PnL) to show the emotional pull that dollars have. Nick went on to say "you'll be a much better trader" if you can remove the emotional pull of those dollars.

In the next post
I'll show Nicks's "Reported Twitter Results" for this calendar year since making a commitment of openness. Trading has been tough for most of us & Nick has not been immuned by trading a portfolio of strategies.

Skate.
 
Pinned tweet.jpg

Trading has been tough for most of us
Nick has not been immune from poor results even by trading a portfolio of strategies. As you read through a few posts in this thread, the amount of information can be overwhelming but you'll learn about different trading styles & strategies. By narrowing your focus you'll have a better understanding of what & what won't work when it comes to the performance of a strategy. When your money is at risk, you easily get fooled by your behavioral biases. Trading is about decision-making, & the more you understand the better decisions you will make.

"The Chartist" trading results
This calendar year after 26 weeks "The Chartist" trading results are in his Twitter feed today. I should also note Nick said, "If you can remove the emotional pull of dollars and focus on the process instead, you'll be a much better trader". Also, @MovingAverage said "trading doesn't get any easier to accept just because it might be 10% to 20% of your portfolio".

How did he get here.jpg

Skate.
 
How did he get here.jpg

I was interested, so others may be as well
In 26 weeks, how did Nick's trading results go from zero to a loss of (-$822,625)?

What's the point of the exercise?
As Nick reports his weekly results I was curious how he fair from week to week. After completing the exercise I was taken back that his weekly cumulative reporting was so inaccurate.

It's easy to make a mistake
@elbee recently pointed out a mistake in one of my posts, we all make mistakes, that's a human trait. All I'm saying is Nick's reported weekly "Twitter Results" at times were inaccurate. It's pleasing that in today's tweets the YTD cumulative is accurate.

Skate.
 
How did he get here.jpg

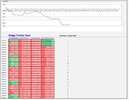
Looking at "The Chartist" Equity curve
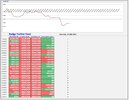
I've always found simple works for me but in saying this I'm one that likes to drill down to understand something a little better. That's why the chart is always at the top because it's a quick visual reference. As the saying goes, a "picture paints a thousand words". The equity chart below is the exact figures taken from Nick's Twitter feeds. Each week Nick posts his weekly & ongoing progress in a consistent format but unfortunately, the reported total aren't consistently accurate.

What do I mean?
Well, so there is no misunderstanding, the "cumulative results" posted today are "accurate" even if they aren't along the way.

Let me explain the Equity Curve Report
(a) The first column is "The Chartist" Weekly Trading Results.
(b) The second column is the "Cumulative Results" from my calculations.
(c) The third column is the "Actual Reported" amounts in Nick's weekly tweets.
(d) The fourth column is "Nick's Reporting Discrepancy" (in all fairness, he got there in the end)

RTF 26 weeks.jpg

Summary
As with any summary, the figures speak for themselves, so I'll just use points.

(a) 10 winning weeks
(b) 16 losing weeks
(c) The average weekly return (-$31,639) ouch...
(d) Nick's weekly (PnL) report was accurate 8 times out of 26 reports
(e) Nick's weekly (PnL) report was inaccurate 18 times out of 26 reports
(f) If you can remove the emotional pull of dollars & focus on the process instead, you'll be a much better trader

Skate.
 
Trading has been tough
It's been tough for some time now & even the best of traders struggle during these times.

You win some you lose some, that's the trading game
I've taken the liberty of posting "The Chartist" six-month results.

For comparison
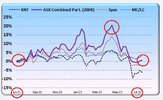
I'll post a chart of @peter2 twelve months performance of his "ASX Combined Portfolio" as a visual reminder.

Reposted without permission
After 12 months of trading, Peter's "ASX Combined Portfolio" is basically square. I've marked the equity curve with red circles to make the analysis of the chart even easier to understand.

How hard is trading.jpg

Skate.
 
Hi @Skate,

You might want to review and amend the table you posted (ref. post #7236).

The month of Feb is where the problem starts.

Cheers,
Rob
 
Hi @Skate,

You might want to review and amend the table you posted (ref. post #7236).

The month of Feb is where the problem starts.

Cheers,
Rob

It's easy to make a mistake
@elbee & now @rnr have both recently pointed out mistakes in my posts. A cut & paste error was to blame. I've now applied the calculations to the individual cells & now I believe them to be accurate. This will be confirmed if no one else spots a mistake.

How did he get here.jpg

There still must be an error
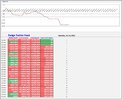
The updated Equity Curve has a loss of (-$1,105,177) whereas Nick reports a loss of (-$822,625).

There is a discrepancy of $282,552 between the results
Rob might be kind enough to confirm if the amounts I've used as well as the calculations are correct as the discrepancy is huge.

I checked the (PnL) for 18th June 2022
This amount appeared character, but checking it appears to be correct

Large Loss.jpg

NTH.jpg

# Summary
Rob or I should say "Eagle eye Rob" spotted an error in the previous table & after making the amendments I've corrected the bullet points.

(a) 10 winning weeks
(b) 16 losing weeks
(c) The average weekly return (-$42,506) ouch...
(d) Nick's weekly (PnL) report was accurate 3 times out of 26 reports
(e) Nick's weekly (PnL) report was inaccurate 23 times out of 26 reports
(f) If you can remove the emotional pull of dollars & focus on the process instead, you'll be a much better trader

Skate.
 
Last edited:
Not that it makes too much of a difference in the long run, but his reported result on the 18th is incorrect.

View attachment 144182
@DaveDaGr8 well spotted
My records were derived from the weekly reports & I missed that daily correction, thank you. The correction made no difference to Nick's final (PnL) as I assume he would have made the adjustment in his next weekly tweet to reflect his current (PnL).

Final Balance Update
I should point out that my final balance has been updated with additional information.

The updated Equity Curve
There was a difference of $110,999 reported by Nick as a typo, & I have corrected the chart to reflect a more accurate result. The average weekly return that Nick has achieved this calendar has also been adjusted to (-$38,237) ouch...

NTH.jpg

# Summary
@DaveDaGr8 spotted a correction Nick made in his 21st June 2022 tweet & after making the amendments I've corrected the bullet points.

(a) 10 winning weeks
(b) 16 losing weeks
(c) The average weekly return (-$38,237) ouch...
(d) Nick's weekly (PnL) report was accurate 3 times out of 26 reports
(e) Nick's weekly (PnL) report was inaccurate 23 times out of 26 reports
(f) If you can remove the emotional pull of dollars & focus on the process instead, you'll be a much better trader

Skate.
 
I still find it incredibly grounding and constantly grateful that Nick, Peter2, Skate and others share candid trading results through such a tough 12 months. It would be so tempting for most traders to go back to the drawing board and fiddle in such tough times. So great to see "pros" plugging away consistently.
 
I still find it incredibly grounding and constantly grateful that Nick, Peter2, Skate and others share candid trading results through such a tough 12 months. It would be so tempting for most traders to go back to the drawing board and fiddle in such tough times. So great to see "pros" plugging away consistently.
Are they ploughing or plugging away?
..sadly i think they are plugging away with fresh banknotes..that is the story for me at least ?
 
I still find it incredibly grounding and constantly grateful that Nick, Peter2, Skate and others share candid trading results through such a tough 12 months. It would be so tempting for most traders to go back to the drawing board and fiddle in such tough times. So great to see "pros" plugging away consistently.

Are they ploughing or plugging away?

From my perspective
@qldfrog, @Newt, trading is much easier when you are playing with their money. I often talk about being lucky in trading. In my opinion, I was lucky to have accumulated a healthy balance before the "$h!t hit the fan". I'm sure it's the same for Nick. My trading process has not changed & I believe Nick's hasn't either.

In saying this Nick's "Growth Strategy" has recently had a "facelift"
After reading the reports, improvements have been made but at the same time, Nick has confirmed he will still trade the original parameters.

Skate.
 
Last edited:
Top