Australian (ASX) Stock Market Forum

Dump it Here

What is position sizing?
For those who don't understand, I should have explained what "position sizing" is In its most basic form. There are those who have trouble with some of the technical terms & this follow-up post will clear this one up.

How much do we bet?
Well, that's a greaty question. The "Position Size" you use decides what your next bet will be in relation to your trading account balance. Position sizing can truly be a powerful tool used correctly. Ultimately, I forgot to say previously that it is up to you to decide what you want to accomplish & how much “portfolio heat” you want to incur as @peter2 would say.

Trading is all about "trying to secure your financial future"
Remember you can’t make money without losing money. As with all trading tools they only work if you consistently use them. Confidence & consistency is the name of this game, as well as money management techniques of course.

Skate.
 
Back-testing to me has always been a waste of time as it can only be repeated in the exact same conditions
I did Chemistry in my Matriculation year and as any Chemist will tell you
All testing can only be done in a vacuum
Ie:No Weather and Sea Variations
ie No Climate Change
No Political Changes / Wars
No Covid /Bird Flu and Plagues etc
and then
Most importantly you have the Mental Health of each Captain ,his Crew their Wives and Children ,extended families and close friends

Come to think about it a lot more
"I don't think you could even do a respectable Back-test on trading in a Vacuum"

Crikey!
I hear People in NSW and QLD are experiencing 100 year floods based on statistics and some have had THREE (3) 100 year floods this year

So much for making the same % gains/losses as yesterday/ yester-month yesteryear/ and even decades ago

Has anyone here ever learnt anything from Back-testing?

View attachment 144189
Interesting post Captain!

What you tackle is Decision Making Under Uncertainty.

An engineer tasked with building a bridge backtests many possible models and scenarios both physical models and computer generated test models. The alternative is....?

You mentioned "any Chemist will tell you", well, I was an industrial chemist in my early days, first for a company making superphosphate then in the movie film industry.

A bit of background.
We brought in sulphur (IIRC from Chile) and rock phosphate (from Nauru, fossilized bird poo, guano).
To make superphosphate we needed to first make sulphuric acid.
We burned the sulphur with excess air to form sulphur dioxide with further reacted under pressure and high temperature with a platinum catalyst to form sulphur trioxide. This was further reacted with water and sulphuric acid to produce highly concentrated acid. All in lead-lined chambers with lead plumbing. The sulphuric acid then was reacted with the rock phosphate (water insoluble so useless for plant growth) to produce the soluble superphosphate which plants can uptake. After curing, mixing in trace elements and granulating, the "super" was bagged and shipped or sold in bulk.

There were many steps from start to finish and many variables to adjust (some of which you listed!).
We had to allow for variations in temperatures, pressures, raw material purity etc etc.
I can assure you that we backtested and backtested and backtested to the nth degree before establishing a process or then modifying any of the processes.

Same in the processing of movie film: we ran test strips and backtested all the slightest variations in temperature and chemical replenishment levels several times a day, failure to do so would have been nasty, especially for colour film!

When you have a shower do you jump under the nozzle then turn hot and cold water on hoping not to get scalded or frozen?
Or do you first backtest the water temperature, making adjustments to hot/cold ratio before getting under the nozzle?

Glad you raised the backtest issue and hope it will generate some useful discussion.
Cheers, Entropy.
 
Why Backtests Fail
It might come as a surprise, but most backtests produce wrong or misleading results on a mass scale. This is why you get a big surprise that your trading systems fail when traded live. Even with out-of-sample data or walk-forward analysis, backtest results are often "over the top" optimistic when reporting their results.

Think about it
If live trading mimicked the backtest results we would all be millionaires.

So what does this all mean?
In a nutshell, the majority of trading systems being backtested that exhibit positive results are in fact unprofitable.

Why so?
For one simple reason, the strategy has no statistical edge. The real dilemma is, how do we fix it?

Skate.
 
Strategy development
During this stage, you have most likely followed all rules or maybe you were lazy & copied crap found on a variety of sites only to discover the strategy is worthless, or worse still, the results give you hope to keep persisting. You can take it from me, even dud strategies will produce the equivalent of random results.

With this false found hope
You will most likely soldier on, changing this, then changing that, until the backtest improves. Doing it this way, the improvements are only on paper & won't be duplicated in the heat of the battle.

What is the driver of this action?
Faulty thinking, thinking "financial success" is just around the corner. The problem is most coded strategies will produce positive results & it's most likely because of the randomness of the markets, the equivalent of a monkey throwing darts.

Skate.
 
The worst thing is that you will rarely get a poor backtest result
A trading strategy with no statistical edge rarely produces a negative backtest result. In most cases, it will most likely produce a positive result that is in fact unprofitable in most cases.

Go figure
Profitable backtest results that are unprofitable when traded live. Has anyone been there, & done that? (I'm guessing so)

Does this mean that backtests are worthless?
What do you reckon? you don't need to be a genius to work that one out. The real problem is that you don't know the strategy has no
statistical edge until it's too late. The penny usually drops when the strategy fails to perform.

Skate.
 
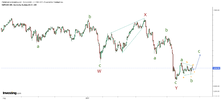
Hurst Projections suggested the possibility of a low in the ASX200 in this post : https://www.aussiestockforums.com/threads/dump-it-here.34425/page-352#post-1181512 back on the 21st June (Winter Solstice) and a multi week rally to follow. Thus far that look to be the case and these are my short term EW musings. The the count may not the best one but it looks like we are headed higher again and a low for wave e should terminte today or tomorrow.
tvc_e8b7f6705ea2a40e67a48332b18c3ef3.png
 
G'day legends.
I have been reading and now trying to code up a version of Laurens Bensdorp’s “Short RSI Thrust” system (from his book "Automated Stock Trading Systems").

There are some rules / conditions that I’m struggling with, I think looping code may be required. Are you familiar with this book or the system? It’s a short system and I'm trying to use amibroker. I think I’m ok to actually code up until entering the trade, but it’s the conditions once in the trade that I’m struggling with:

Stop-Loss: The day after the (limit) short position is entered, place a buy stop of three times ATR of the last ten days above the execution price.

Profit Taking: If at the closing price , the profit in the position is 4 percent or higher, get out the next day’s market on close.

We also have a time-based exit: If after two days the trade has not reached its profit target, we place a market order on close for the next day.

I think looping is required because of the tricky exit rules. Any help or tips would be greatly appreciated!
 
@wasp your request for help should be directed to the Amibroker FQA thread - found here:

Alternatively
Direct your question to the Amibroker forum - found here:

To get a quick response
When seeking help, from the Amibroker forum please include what you have done so far. They will need to see your work to offer any assistance. Make sure you explain "what you can’t get working", detailing the issue in depth. When you do this there will be someone who will help you out.

On the Amibroker forum make sure you follow the rules, especially these two
NOTE 1: Always use the Code Tags when posting code.
NOTE 2: Use the SEARCH feature (magnifying glass "top right" by your avatar) to see if something similar has already been discussed.

Skate.
Thanks Skate, apologies for posting in the wrong thread. I’ll get some more info and code then post it there later in the week. Cheers.
 
Why Backtests Fail
It might come as a surprise, but most backtests produce wrong or misleading results on a mass scale. This is why you get a big surprise that your trading systems fail when traded live. Even with out-of-sample data or walk-forward analysis, backtest results are often "over the top" optimistic when reporting their results.

Think about it
If live trading mimicked the backtest results we would all be millionaires.

So what does this all mean?
In a nutshell, the majority of trading systems being backtested that exhibit positive results are in fact unprofitable.

Why so?
For one simple reason, the strategy has no statistical edge. The real dilemma is, how do we fix it?

Skate.
Skate, nice post here along with your previous posts, you raise some interesting questions!
I admire the energy you bring to this forum, long may it continue!

Let's start with the comment of a legend:

“It is remarkable how much long-term advantage people like us have gotten by trying to be
consistently not stupid, instead of trying to be very intelligent.” - Charlie Munger

How can we follow this advice, instead of trying to be too smart just try to be not stupid?
If a farmer is trying to sell off his geese that lay golden eggs are we stupid enough to buy them?
Even if the farmer is a top bloke: will he just sell us the eggs?

Where to start?

Stock prices are data presented to us in a time-series format.
From this data, and maybe combined with some other data, we want to make money.

What is the character of the time series data, this sequence of numbers we pore over?

Some people say the data alone are just random numbers and any attempt to make predictions using such a sequence of random numbers is futile: if you can predict random numbers just a little you would be the scourge of the casinos!

(Note: some people believe stock data is 'fractal', eg Nick Radge. Any discussion of random data could also include fractal data.)

If share prices data are randomly generated or a fractal then any mathematical operations applied to such time-series data such as addition, subtraction differencing etc etc will not be of any help to make the series.
Much of traditional statistics lore cannot be applied since the share prices are autoregressive ie a given value is highly correlated to the value at the previous time period.

Others say if the data are random how do you explain the obvious trends in the data that we see?

This question regarding randomness has been asked and also answered (sort of) here:

Basically, one can never prove a sequence of numbers is randomly drawn or not but one can get somewhere:

Just when one thinks we are on top of things:

Start of quote:

The seven states of randomness in probability theory, fractals and risk analysis are extensions of the concept of randomness as modeled by the normal distribution.
These seven states were first introduced by Benoît Mandelbrot in his 1997 book Fractals and Scaling in Finance, which applied fractal analysis to the study of risk and randomness.

This classification builds upon the three main states of randomness: mild, slow, and wild.

The importance of seven states of randomness classification for mathematical finance is that methods such as Markowitz mean variance portfolio and Black–Scholes model may be invalidated as the tails of the distribution of returns are fattened: the former relies on finite standard deviation (volatility) and stability of correlation, while the latter is constructed upon Brownian motion.

These seven states build on earlier work of Mandelbrot in 1963: "The variations of certain speculative prices" and "New methods in statistical economics" in which he argued that most statistical models approached only a first stage of dealing with indeterminism in science, and that they ignored many aspects of real world turbulence, in particular, most cases of financial modeling.

Wild randomness has applications outside financial markets, e.g. it has been used in the analysis of turbulent situations such as wild forest fires.

Using elements of this distinction, in March 2006, a year before the Financial crisis of 2007–2010, and four years before the Flash crash of May 2010, during which the Dow Jones Industrial Average had a 1,000 point intraday swing within minutes, Mandelbrot and Nassim Taleb published an article in the Financial Times arguing that the traditional "bell curves" that have been in use for over a century are inadequate for measuring risk in financial markets, given that such curves disregard the possibility of sharp jumps or discontinuities.
Contrasting this approach with the traditional approaches based on random walks, they stated:

We live in a world primarily driven by random jumps, and tools designed for random walks address the wrong problem.

Mandelbrot and Taleb pointed out that although one can assume that the odds of finding a person who is several miles tall are extremely low, similar excessive observations can not be excluded in other areas of application.
They argued that while traditional bell curves may provide a satisfactory representation of height and weight in the population, they do not provide a suitable modeling mechanism for market risks or returns, where just ten trading days represent 63 per cent of the returns of the past 50 years.


The difference ten days make:
By removing the ten biggest one-day moves from the S&P 500 over the past 50 years, we see a huge difference in returns.
And yet conventional finance treats these one-day jumps as mere anomalies.

End of quote.

Skate, your comments re failure of backtesting are valid in light of the last sentence!

I have attached the aforementioned pdf.
 

Attachments

  • FT-MandelbrotTaleb.pdf
    702.6 KB · Views: 3
Skate, nice post here along with your previous posts, you raise some interesting questions!
I admire the energy you bring to this forum, long may it continue!

Let's start with the comment of a legend:

“It is remarkable how much long-term advantage people like us have gotten by trying to be
consistently not stupid, instead of trying to be very intelligent.” - Charlie Munger

How can we follow this advice, instead of trying to be too smart just try to be not stupid?
If a farmer is trying to sell off his geese that lay golden eggs are we stupid enough to buy them?
Even if the farmer is a top bloke: will he just sell us the eggs?

Where to start?

Stock prices are data presented to us in a time-series format.
From this data, and maybe combined with some other data, we want to make money.

What is the character of the time series data, this sequence of numbers we pore over?

Some people say the data alone are just random numbers and any attempt to make predictions using such a sequence of random numbers is futile: if you can predict random numbers just a little you would be the scourge of the casinos!

(Note: some people believe stock data is 'fractal', eg Nick Radge. Any discussion of random data could also include fractal data.)

If share prices data are randomly generated or a fractal then any mathematical operations applied to such time-series data such as addition, subtraction differencing etc etc will not be of any help to make the series.
Much of traditional statistics lore cannot be applied since the share prices are autoregressive ie a given value is highly correlated to the value at the previous time period.

Others say if the data are random how do you explain the obvious trends in the data that we see?

This question regarding randomness has been asked and also answered (sort of) here:

Basically, one can never prove a sequence of numbers is randomly drawn or not but one can get somewhere:

Just when one thinks we are on top of things:

Start of quote:

The seven states of randomness in probability theory, fractals and risk analysis are extensions of the concept of randomness as modeled by the normal distribution.
These seven states were first introduced by Benoît Mandelbrot in his 1997 book Fractals and Scaling in Finance, which applied fractal analysis to the study of risk and randomness.

This classification builds upon the three main states of randomness: mild, slow, and wild.

The importance of seven states of randomness classification for mathematical finance is that methods such as Markowitz mean variance portfolio and Black–Scholes model may be invalidated as the tails of the distribution of returns are fattened: the former relies on finite standard deviation (volatility) and stability of correlation, while the latter is constructed upon Brownian motion.

These seven states build on earlier work of Mandelbrot in 1963: "The variations of certain speculative prices" and "New methods in statistical economics" in which he argued that most statistical models approached only a first stage of dealing with indeterminism in science, and that they ignored many aspects of real world turbulence, in particular, most cases of financial modeling.

Wild randomness has applications outside financial markets, e.g. it has been used in the analysis of turbulent situations such as wild forest fires.

Using elements of this distinction, in March 2006, a year before the Financial crisis of 2007–2010, and four years before the Flash crash of May 2010, during which the Dow Jones Industrial Average had a 1,000 point intraday swing within minutes, Mandelbrot and Nassim Taleb published an article in the Financial Times arguing that the traditional "bell curves" that have been in use for over a century are inadequate for measuring risk in financial markets, given that such curves disregard the possibility of sharp jumps or discontinuities.
Contrasting this approach with the traditional approaches based on random walks, they stated:

We live in a world primarily driven by random jumps, and tools designed for random walks address the wrong problem.

Mandelbrot and Taleb pointed out that although one can assume that the odds of finding a person who is several miles tall are extremely low, similar excessive observations can not be excluded in other areas of application.
They argued that while traditional bell curves may provide a satisfactory representation of height and weight in the population, they do not provide a suitable modeling mechanism for market risks or returns, where just ten trading days represent 63 per cent of the returns of the past 50 years.


The difference ten days make:
By removing the ten biggest one-day moves from the S&P 500 over the past 50 years, we see a huge difference in returns.
And yet conventional finance treats these one-day jumps as mere anomalies.

End of quote.

Skate, your comments re failure of backtesting are valid in light of the last sentence!

I have attached the aforementioned pdf.
Great post @entropy. Thanks
 
You can take it from me, even dud strategies will produce the equivalent of random results.

"Past success does not guarantee future performance."
You'll see this warning tacked onto everything from those wishing to sell you something trade-related. What exactly does it mean?

Trading involves risk
Trading is a risky process that centres around the process of making good decisions & managing risk. With systemic traders, it is about the methodology & process that counts. Past results can be helpful when analysing a strategy, as long as the time horizon is meaningful "to you". Also, the past returns can be a helpful metric when choosing to evaluate a strategy further.

Skate.
 
It's so confusing evaluating strategies
When confronted with a backtest result, it's daunting to know if the results are any good let alone if it's a tradable strategy. Them whemn you compare two side-by-side backtest results can be doubly confusing, to say the least. So, how do you evaluate the results?.

First off
You need to understand each of the metrics as they tell their own individual story. It's for you to decide what you are trying to understand & which metric will get you there. Doing so will be the metric to establish the baseline. Bloody hell, which metric is the best one to use?

A signal backtest is not an evaluation
In the next series of posts, there will be two backtest reports for consideration. It's a single backtest of a Random Strategy versus my recent "Lipstick on a Pig Strategy". The example is to show how nothing is easy when it comes to reading a backtest report. Trying to establish which strategy is the best is not as easy as it looks.

Skate.
 
Choosing a backtest metric for the evaluation & validation process
The journey starts by researching a trading method that has been proven to work in the past. Once the idea turns into a process all that is left is to verify that the system will work today as it has in the past.

When choosing a metric for validation
It's ideal to stay with the same metric because the comparison between results will be more consistent than jumping from one metric to another "consistency is what we are ultimately after".

Skate.
 
Even the best of us think "is the strategy any good?"
We all struggle with the question of whether the strategy is good. Can the backtest report be relied upon? When we establish a basic trading strategy, the backtest should indicate if the strategy is any good, right? At this stage, what do the backtest results tell us? What the hell do we do next?

Maybe a little fiddling is all that is required
Faulty thinking now sets in. You know what? with a little tinkering, you start to believe this strategy is worthy of additional effort. You set about making "small refinements" after "small refinements" & Bob's your uncle it's the duck's guts. This is when you start dreaming, believing your own bull$hit. Yes, your mind confirms it, this is the best strategy so far, as all the others you traded just lost money. Then, with confidence, you will start to trade this strategy only to find it didn't perform as expected, thus the cycle starts all over again.

Skate.
 
Let's talk about Metrics for a moment
Metrics is one of the most academic topics for evaluating trading systems. There are so many of them we all find it difficult to know which one is more appropriate to evaluate a specific system. It's really quite frustrating at times.

What is a good metric?
I've seen it stated that "there is no better metric than your trading account balance". For a start, don't use that metric as it might be "all over red rover" before you know the answer.

By removing the ten biggest one-day moves from the S&P 500 over the past 50 years, we see a huge difference in returns.

Outliers
@entropy is on to something here because I've noticed in my testing a good part of the gains comes from a few stocks that move a lot but that's how a trend-following strategy works. Eliminating the outliers as suggested by a few others can skew the results going from persevering with a handy strategy to discarding a perfectly good strategy.

Skate.
 
A large drawdown is acceptable
Large drawdowns during backtesting are rarely given a second thought when the strategy displays a large profit. Faulty thinking is when you believe "profits" are more important than a 20, 30, or even a 40% drawdown. When you alert others that profits are not the benchmark or metric to use, it's like “water off a duck's back”. I've found over time no matter what you say, people "will do what they want to do".

Drawdowns are an important metric
And it's no more important when your money is on the line. The level of drawdown that you believe you can handle will be tested in ways that you would not have thought possible. From the holdings period to increased winners with a reduction in the number of trades also needs to be considered. Most of all, I'm always seeking to achieve a lower drawdown that results in a better Car/MDD metric & a few others.

Skate.
 
Well, I finally got here
Understanding a backtest report is hard enough. But when it comes to comparing two backtest reports, life becomes a little more difficult.

Jumping to conclusions
Making a "quick judgment call" might have kept us alive back in the good old days from being eaten by a tiger but "jumping to a conclusion" is certainly not helpful when it comes to trading.

When comparing the backtest results
I can tell you with all certainty that "you will form an opinion straight away" without using any effort.

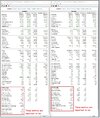
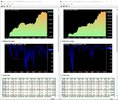
"Random" versus the "Pig"
The backtest reporting period is from the 1st of July 2015 to today (the actual time I've been trading). I'll use those dates for all my examples so there is no cherry-picking. The "LH backtest" is from a random entry, nothing fancy just using the MACD. The "RH Backtest" is my latest creation (Lipstick on a Pig Momentum Strategy) coded up only a few weeks back.

Random v Pig Metrics.jpg


Equity.jpg


Skate.
 
Amibroker Backtest Explanatory notes
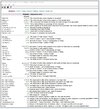
I got thinking. Maybe not everyone knows what the terminology means in the backtest report or how the figures are derived. The explanation is in no way comprehensive but a short description at times is all that is required.

EXPLANATION of the Metrics.jpg

Skate.
 
Well, I finally got here
Understanding a backtest report is hard enough. But when it comes to comparing two backtest reports, life becomes a little more difficult.

Jumping to conclusions
Making a "quick judgment call" might have kept us alive back in the good old days from being eaten by a tiger but "jumping to a conclusion" is certainly not helpful when it comes to trading.

When comparing the backtest results
I can tell you with all certainty that "you will form an opinion straight away" without using any effort.

"Random" versus the "Pig"
The backtest reporting period is from the 1st of July 2015 to today (the actual time I've been trading). I'll use those dates for all my examples so there is no cherry-picking. The "LH backtest" is from a random entry, nothing fancy just using the MACD. The "RH Backtest" is my latest creation (Lipstick on a Pig Momentum Strategy) coded up only a few weeks back.

View attachment 144323


View attachment 144324


Skate.
Nice presentation, Skate!
I don't subscribe to a trading platform so your superb display of statistics and graphics is beyond my home-made Python efforts. The metrics you indicate are important to you also make sense to me, except the 'Stale Stop', could you elaborate?
I will attempt to code up these metrics to see how my results compare.

Is it possible to re-run you code and report the backtest results for say the approx five years only 2018 to 2022?
I am interested to see how the more recent data pans out.

Because we are dealing with making decisions under uncertainty I prefer to look at distributions of outcomes rather than specific outcomes. That way I can get a feel for the range of possible outcomes and assess my risks.
 
Top