- Joined
- 28 December 2013
- Posts
- 6,392
- Reactions
- 24,319
These pull-backs in price form after break-outs and whenever bullish sentiment temporarily pauses inducing weaker holders and profit takers to sell in order to grab their short term gains.
Trading pull-backs
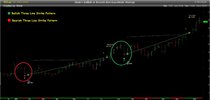
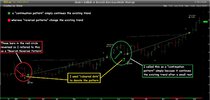
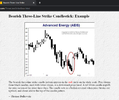
I'm not inferring that @peter2 trades the "Three Line Strike" candlestick pattern but rather I'll try & blur the lines between his method & the number one method using candlestick patterns. The number one candlestick pattern from the video was the "Three Line Strike" Candlestick Pattern.
The colour of the candlestick or price bar is either green or red
I personally don't chart with candlesticks as I prefer the look of a bar chart. Also, it would be prudent for me to mention that the colours of the bars can vary to the relationship of the previous bar or alternatively, whether the opening price is lower than the closing or vice versa. I'll later post a bar chart to demonstrate that trading pull-backs after a temporary pause can be a beneficial way of trading.
But first a little about Technical Analysis
At times it can be confusing when technical analysis (TA) & fundamental analysis (FA) is discussed. They both try to achieve that same result even though the path is different. But as usual, I'll be concentrating on the virtues (TA) as trading this way depends on finding mathematical repeatable patterns.
"Why are you making a series of posts on a pattern you have found no value in?"
It's a reasonable question. Well, the simple answer is that there may be some who are interested & as I've spent so much time evaluating candlestick patterns & it allows me to post some of the findings of my research.
Skate.

