Australian (ASX) Stock Market Forum

Dump it Here

Now that's what I'm talking about
@entropy to have any chance in this game you need a plan & your plan is solid. If you keep your trading plan consistent you'll do okay as consistency is the name of the game.

In between the signals, just hang on for the ride
No matter what your selection criteria were, or what has motivated you to place a ‘buy’ order, you have to realise "everything is out of your control" from that point on till you elect to sell, so in the meantime just hang on for the ride.


View attachment 136765


Guppy's Multiple Moving Averages
Looking at three pairs of moving averages performs as a trend trading strategy. As trend trading strategies go, using "Guppy's Multiple Moving Averages" would be a suitable choice for you to have a look at as it's easy to follow & understand.

Sometimes more is better
I understand you use three moving averages whereas Guppy uses twelve EMA's. It's the relationship between the twelve exponential moving averages (EMA's) that tells the story of long & short-term buyers. The (GMMA) is composed of multiple lines that help traders see the strength or weakness in a trend better than if only using one or two moving averages or (EMAs). Compression to the expansion of the “lines of the ribbon” tells one story whereas the reverse (expansion to compressions) tells another. On the other hand, the "crossing" of the ribbons, is a whole other story in itself.

Skate.
Thanks Skate! I will take a look at Guppy's work.

Was there an Ogden Nash ditty that went: cats have kittens, dogs have puppies, guppies have guppies?
 
Trading
Trading is just about selecting companies that you believe will increase in price over time. Once you place your buy order, just hang on for the ride as it's all you can do from here on (the black line in my post above). Once you place a buy order the only thing left for you to do is manage your sell orders as everything is in the lap of the gods. Trading is an emotional roller coaster & how you manage your psychology really matters even more than your stock selection.

Trading is all about price movement.
Nothing works perfectly in trading so the next best thing is to accept that sometimes it works well & other times it doesn't. Last week it certainly didn't go to plan, why? because you can't code for the unexpected. I should clarify the last statement. You can code for a steady decline but unfortunately when the decline is rapid during "one week" you just have to suck it up. Those that can handle that & "roll with the punches" will do okay. Forget about the money & focus on the process of successful trading. The more you obsess about the money the more likely it will derail your success.

I mean everyone
Every strategy & every trader will have periods of good performance & periods of poor performance. Accepting "losing periods" helps you to remain focused on the long-term outcome. Learning how to control your emotions when your account suffers a few losses allows you to grow as a trader.

Skate.
 
No one like to hear their baby is ugly
Well in essence that's what happened when I was recently told, my "Flying Bat Strategy" is a "dud". Well, that may be true but I'm prepared to let the strategy mature to see if it can turn from an "ugly duckling into a swan". The "duck analogy" will have to do as the analogy would lose its meaning when you realise a baby bat is called a "pup".

Using a small sample
Let's not revisit the debate about a small backtest sample size & the relevant meaning it holds. But what I would like to do is to give the backtest for the "Flying Bat Strategy" (a) trading period & (b) a backtest for the last 365 days, meaning the previous year's backtest.

So how is the "Flying Bat Strategy" performing?
At the moment it's struggling but for no other reason than the uncertainty the markets hold with the participants running scared, otherwise, it tracking the backtest results. There is a discrepancy comparing the results between my actual results & the "Amibroker backtests". Simply it's the methodology that Amibroker uses to enter & exit trades that differs slightly from mine. I trade using the signals from the "Amibrokers Exploration Analysis" using my own mathematical formula that is subject to a trading plan when determining to place a buy & sell offer. For the sake of the exercise, it's close enough.

Backtest results
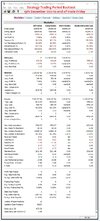
The capture below is the backtest for the "Flying Bat Strategy" trading period (13th December 2021 to 28th January 2022)

Flying Bat.jpg


Actual trading results
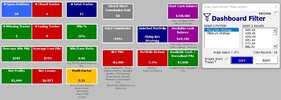
The capture below is the actual trading results for the "Flying Bat Strategy" trading period (13th December 2021 to 28th January 2022). Both the Backtest & actual results are disappointing & I can fully understand why it was called a "dud". The uploaded weekly results & the shootout will be uploaded in real-time each week to establish if this strategy can turn things around in the next 5 months.

Flying Bat Actual.jpg


I hate lengthy posts
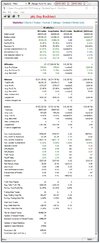
But in all fairness, I'll post a 365 day backtest for completeness. All strategies take time to develop & at times we can be too quick to judge if a strategy is worth the extra time to prove its worth. I should also say if the strategy is a "dud" you'll never lose a great deal of money as this strategy will pull you out when things are not going to plan.

365 FB.jpg

Summary
I'm prepared to lose a little in the short term in the "hope" the long-term outcome mimics the results above. Trading is a game of probabilities.

Skate.
 
What would be your gauge to drop the "Flying Bat Strategy?"

@Sir Burr it's not about the dollar amount or number of consecutive losses nor is it the drawdown percentage when live trading but more to do with "not overriding" the strategy. There will be a stage where losses are more of an irritation than a worry. Large losses really annoy me but strangely enough, large wins never do. I forgot to say, "all the hard work has previously been done"

The Flying Bat Strategy - overview
It's a simple strategy that uses a few indicators to sharpen both the entry & exit signals. As the strength of a trend is so important in filtering out false signals, I've decided to use the "RSI, StochD & MACD" indicators in "combination" to return the best bang-for-buck. Those three indicators are at the very heart of everything this strategy hopes to achieve. The premise behind the idea is simple. Enter on a confirmed trend with strength & get out when strength fails to keep building. At times it can be slow to accumulate positions as it's very selective. This strategy has a complex exit strategy that incorporates a "take profit stop".

Skate.
 
If we start a trend following trading system just before a significant market selloff the early results will never look good. It doesn't indicate that the system is a dud. The system realised the losses as it should. It's now that beginning traders look for another system that seems better. This is the start of the beginners or amateur cycle. They fail to understand that profitable systems will have losing periods.

I hope that @Skate continues with his current project and shows how both his current systems work their way out of their drawdowns and back into profit.

There is no way of knowing how long this process will take because the results are at the mercy of the market.

Working your trading system through a drawdown and back into profit is a very satisfying experience. One that enhances a traders confidence significantly.
 
Loosing money last week should not be a problem for any relaxed system traders.it is expected.
But if you have a steady growing market, peers making profit and your system is not catching up, then it is time to wake up and check for issues.
A bad experience last year as explained in my hashed prose on my thread is a nice example of such a counter trend and the need to react and investigate.
But once the issue is fixed, you should then see clear benefits

The week before last was my best ever, while last week was my worst.but so far keeping cool:
all within expected variations
Systems are now more in cash so losses will reduce if the fall goes on, but we still have buys on Monday which will gains if the markets btd.
Whatever happens , i just follow the instructions.
now is not the time to tweak
 
If we start a trend following trading system just before a significant market selloff the early results will never look good. It doesn't indicate that the system is a dud. The system realised the losses as it should. It's now that beginning traders look for another system that seems better. This is the start of the beginners or amateur cycle. They fail to understand that profitable systems will have losing periods.

I hope that @Skate continues with his current project and shows how both his current systems work their way out of their drawdowns and back into profit.

There is no way of knowing how long this process will take because the results are at the mercy of the market.

Working your trading system through a drawdown and back into profit is a very satisfying experience. One that enhances a traders confidence significantly.
@peter2 I know this is not directed at me, but it probably could be! Started January 10th. See you all for the first monthly update after tomorrows close! Hahaha!
 
@Cam019 Not sure whether to laugh or cry with you after your post.
However I know you're not some beginner who would be scared out of their trading plan after an immediate (untimely) drawdown. Lets discuss your results in 3 years (36 mths) time heh?
 
it's not about the dollar amount or number of consecutive losses nor is it the drawdown percentage
Just examples of what people may use to turn off a system.
Another might be the equity curve dropping below a MA.

Curious if there is a indicator for pulling the pin on The Fly Bat Strategy as it's a mechanical system.

Best answer so far...
peers making profit and your system is not catching up
 
@Cam019 Not sure whether to laugh or cry with you after your post.
However I know you're not some beginner who would be scared out of their trading plan after an immediate (untimely) drawdown. Lets discuss your results in 3 years (36 mths) time heh?
No point crying Peter. You may as well laugh because the only thing we can control as traders is our emotions and our (hopefully lack of) reactions.

You're right - I won't be throwing in the towel. I know this system is profitable over the long term and I also know that I shouldn't even bat an eyelid if I see a 20-25% DD. Common place using this system.
 
Curious if there is a indicator for pulling the pin on The Fly Bat Strategy as it's a mechanical system.

@Sir Burr that's a simple enough question that I may answer in stages so others can understand my logic. I apologise for the delay in answering your question but I've been busy. Also I'll type as quick as possible & as aways the response won't be proof read.

What gets me out of a position - I'll list them so it's not confusing
1. For a start the "Flying Bat Strategy" doesn't use an "Index Buy Filter" but it does use an Index Filter to control the trailing stop. The trailing stop is a two-tied percentile exit strategy, meaning a larger stop when the Index is deemed to be on that shortens when the Index Filter turns off.
2. The "Flying Bat Strategy" incorporates a "Take profit Stop" (not what you are asking but worth mentioning)
3. The "Flying Bat Strategy" incorporates a "multilayer" stale stop.

Let's talk about a "Stale Stop" it's critical
First off the "Stale Stop Exit Strategy" is to gauge when momentum is shifting, slowing, or reducing. Lack of momentum in the right direction will stifle performance. The "Stop Stop Exit" is measured bar-by-bar. There are multilayers to the "stale exit" as momentum needs to be calculated bar-by-bar from every angle.

So what is in my "Stale Stop Exit"?
(a) GTFO Indicator. This indicator gets bandied around as if it's a mainstream indicator, which it isn't.
(b) There is also a nPeriod Moving Average with a twist. That single line adds to the story.
(c) Momentum is measured by "StochD & MACD" indicators. The parameter setting is tuned so they to work together.
(d) Also there has to be a "line in the sand" drawn so that the high of the entry is not less than the previous nPeriod (this is important)
(e) I also incorporate a "Bollinger Bands" volatility exit with the Norgate "Delisted" function.

This "Stale Stop Exit" appears complicated & it is
Well, using a standard stand-alone "Trailing Stop" exit doesn't cut it in many ways as a "Trailing Stop" will give back so much open profit & makes the drawdown look pathetic. I enter on confirmed trend & when the trend loses steam I want to be off the ride. The only issue is when trading a weekly strategy you need to endure the "weekly volatility".

You win some & you lose some
There is no guesswork when trading a systematic trend system because the decision to enter & exit is determined by the strategy. Unfortunately, there will be times when you experience a string of losses all because you are letting your system make all your decisions for you.

Summary
When the tough times hit, I pray that I've done a good enough job during the "off-season".

Skate.
 
@peter2 I know this is not directed at me, but it probably could be! Started January 10th. See you all for the first monthly update after tomorrows close! Hahaha!
@Cam019 , i decided to remove my SL and go full system early 2020 after starting my first system late 2029.what you will tell us will be a breeze as opposed... i feel your pain.
Most of my current systems also restarted in December so no previous gain to cushion this month....you are not alone ?
 
my "Flying Bat Strategy" is a "dud". Well, that may be true

Thanks Skate, the only reason I asked is because of the above comment. Nothing to do with it looking a dud but thought good timing to jump in while the market has dropped 10% or whatever :D

I know very well, starting a system sees it go straight into drawdown as it exits the non-trending and hangs onto the trending.

Not talking about an index filter here but turning the system off and moving on due to under performance, not living up to the backtest results. I would have thought being a system, the most obvious thing would to use an indicator and not by emotions.

I'm now wondering if there are other systems coded & discussed in this thread that have been dumped along the way and if so how was the decision made. Gut or indicator.
 
Last edited:
@Cam019 , i decided to remove my SL and go full system early 2020 after starting my first system late 2029.what you will tell us will be a breeze as opposed... i feel your pain.
Most of my current systems also restarted in December so no previous gain to cushion this month....you are not alone ?
Typo: i meant covid crash hit after starting late 2019
 
I'm now wondering if there are other systems coded & discussed in this thread that have been dumped along the way and if so how was the decision made. Gut or indicator.

@Sir Burr I code a lot of systems, paper trade them & ultimately will trade most of them
When I code a new system I'm eager to trade it & if I don't stop trading the older strategies the new strategies can't have their day in the sun. What I'm fumbling to say is this, "I'll stop trading good performing strategy just to play with something else". In saying this I have a few strategies I've been trading for a while & I have never considered benching any of them.

I know very well, starting a system sees it go straight into drawdown as it exits the non-trending and hangs onto the trending.

The "Platinum Strategy" & the "Flying Bat Strategy" are the two latest systems in my stable
If I thought they were "Duds" I wouldn't be giving weekly live signals with ongoing weekly reports. I'm expecting these two to perform as expected over time & the shootout will determine which coding methods work the best.

All trend trading strategies will perform in a bull market
Seasoned traders all know "trend trading" depends on a buoyant market & suffers when it's not.

Summary
There are a few who are trading along & they won't be happy if they don't perform. I would also like to say, "there is never a good time to start trading a new strategy" so it pays to give the strategy a little time to perform its mathematical advantage.

Skate.
 
No one like to hear their baby is ugly
Well in essence that's what happened when I was recently told, my "Flying Bat Strategy" is a "dud". Well, that may be true but I'm prepared to let the strategy mature to see if it can turn from an "ugly duckling into a swan". The "duck analogy" will have to do as the analogy would lose its meaning when you realise a baby bat is called a "pup".

Using a small sample
Let's not revisit the debate about a small backtest sample size & the relevant meaning it holds. But what I would like to do is to give the backtest for the "Flying Bat Strategy" (a) trading period & (b) a backtest for the last 365 days, meaning the previous year's backtest.

So how is the "Flying Bat Strategy" performing?
At the moment it's struggling but for no other reason than the uncertainty the markets hold with the participants running scared, otherwise, it tracking the backtest results. There is a discrepancy comparing the results between my actual results & the "Amibroker backtests". Simply it's the methodology that Amibroker uses to enter & exit trades that differs slightly from mine. I trade using the signals from the "Amibrokers Exploration Analysis" using my own mathematical formula that is subject to a trading plan when determining to place a buy & sell offer. For the sake of the exercise, it's close enough.

Backtest results
The capture below is the backtest for the "Flying Bat Strategy" trading period (13th December 2021 to 28th January 2022)

View attachment 136770


Actual trading results
The capture below is the actual trading results for the "Flying Bat Strategy" trading period (13th December 2021 to 28th January 2022). Both the Backtest & actual results are disappointing & I can fully understand why it was called a "dud". The uploaded weekly results & the shootout will be uploaded in real-time each week to establish if this strategy can turn things around in the next 5 months.

View attachment 136769


I hate lengthy posts
But in all fairness, I'll post a 365 day backtest for completeness. All strategies take time to develop & at times we can be too quick to judge if a strategy is worth the extra time to prove its worth. I should also say if the strategy is a "dud" you'll never lose a great deal of money as this strategy will pull you out when things are not going to plan.

View attachment 136771

Summary
I'm prepared to lose a little in the short term in the "hope" the long-term outcome mimics the results above. Trading is a game of probabilities.

Skate.
Excuse my ignorance, Skate, still new to trading and associated software.
I roll my own with Excel/VBA and recently started following Howard Bandy's posts to roll my own Python model and testing program.

The tables that you post like "365 Day Backtest": are these results from a hold-out sample?
That is do you, say, for argument's sake, choose 10 years of trading data then split this into two sets of data, a training/development set of say 9 years of data and a holdout set of the recent 1 year of data.

The 9 years of training data is filtered in some way to produce profitable candidate stocks. They are then followed in the recent 1 year of holdout data to see if they remain profitable?

It seems filtered candidate stocks whose profitability collapses when live traded may suffer from what Bandy calls "loss of stationarity" ie distributional measures (for example means, std dev etc) of test data are not the same for holdout data nor are the same for live data.
Any comments appreciated.
 
The tables that you post like "365 Day Backtest": are these results from a hold-out sample?

@entropy let me put the 365 days backtest into perspective first. To give an indication of how a strategy would have performed in the past using Norgate Platinum Data I could pick any backtest period. I use 365 days so the backtest can't be cheery picked as I use today's date as the reference point. Choosing a variety of lookback periods allows you to understand how your finalised strategy would perform on past data. The backtest is the index I choose to trade.

That is do you, say, for argument's sake, choose 10 years of trading data then split this into two sets of data, a training/development set of say 9 years of data and a holdout set of the recent 1 year of data.

Nah, what you are talking about is done in the strategy development phase
The backtests that I'm throwing up (the backtest captures) are after all the development has been completed with the strategy being finalised & physically traded. To get to a "stage where a strategy can be traded live" lots of work has already been done, similar to what you are referring to.

Strategy Development & Monte Carl simulations
But as you have mentioned strategy development I'll post a little about Monte Carlo simulations & backtesting. Once you have a set of metrics which do you use to compare apples with apples & not apples with oranges.

Let's talk about backtesting (the period selected)
Backtesting a lot of data can be a good thing but backtesting over a longer time frame, there is always the randomness of outliers skewing the results leading you down the path of changing the code to fit the randomness of outliers. Meaning, just be aware of the randomness of outliers before making any significant changes to your strategy.

It can mess with you (Monte Carlo is important)
Backtesting over a large data set "randomness" can mess with you & your strategy development. Concentrate on the Monte Carlo “Out Of Sample” (OOS) results & take much less notice of the Monte Carlo “In Sample” results.

It's important
Monte Carlo results can be a missing metric in the development of a strategy. In reality, outliers can falsely lead you down a path of strategy correction lowering the probability of returns when actively trading the system compared to your backtesting results. The more you learn the more you understand the importance of having statistical data to compare results. Monte Carlo Simulations adds randomness to the strategy by running several thousand simulations using different data points to compute the average of the results.

Microsoft Excel
Originally, I used Microsoft Excel to visualise this data from the Monte Carlo Simulations creating a histogram showing the minimum & maximum return. With that same data, I was able to create a "scatter plot" to show the average annual returns versus the maximum drawdowns. But from AmiBroker version 5.94 onwards, a Monte Carlo simulator is built-in to the backtest, saving you all this extra work.

The general idea behind Monte Carlo analysis
Monte Carlo Analysis is a process of validating the robustness of the Trading Strategy by performing multiple trials runs using a combination of positions from your trading system (backtested data). It's worthy to note "seasonality" automatically becomes part of the equation. You can use these statistics to analyse the characteristics of your trading system simulating a set of Equity curves using random numbers from the backtest data. These large sets of simulations are then used to find the likely probability of unseen risks in your trading strategy. The Monte Carlo Simulations "out-of-sample" (OOS) results are the true measure of the strategy. Why? because the strategy has been developed using "in-sample" data & is already known.

Monte Carlo Simulation
This process allows you to randomly select any number of Monte Carlo runs. I run either 100 or 1,000 runs all depending on how quickly I want to view the results. The more runs the more reflective the results will be. I prefer to use 1,000 runs which means 1,000 different trades from the original trade list. 1,000 runs are used to produce new random trades thus it's unlikely to pick the original "PostionScored" trades.

1,000 runs will give a random perspective of the robustness of your strategy
Understanding the robustness of your trading system helps identify any problem with your trading strategy. It's worthy to understand "Monte Carlo" analysis will not solve any problems. To put it in simple terms "Monte Carlo Simulation" is just a validation process, a tool to help you create a better trading system.

Interpreting the results
The results of the Monte Carlo simulations are displayed in the "Monte Carlo" tab of the Backtest report. At the top of the backtest results, the Monte Carlo tab displays a table that gives values of a few key statistics derived from the cumulative distribution charts.

Use the Search Feature
If you don't understand a particular terminology or simply want to know more use the "search feature" with "keywords" or phrase by "Skate". After 3422 posts in this thread, I've most likely posted about a range of questions you could think to ask. Lengthy answers might be what you are seeking but they become a pain for others to read.

Skate.
 
@entropy let me put the 365 days backtest into perspective first. To give an indication of how a strategy would have performed in the past using Norgate Platinum Data I could pick any backtest period. I use 365 days so the backtest can't be cheery picked as I use today's date as the reference point. Choosing a variety of lookback periods allows you to understand how your finalised strategy would perform on past data. The backtest is the index I choose to trade.


Nah, what you are talking about is done in the strategy development phase
The backtests that I'm throwing up (the backtest captures) are after all the development has been completed with the strategy being finalised & physically traded. To get to a "stage where a strategy can be traded live" lots of work has already been done, similar to what you are referring to.

Strategy Development & Monte Carl simulations
But as you have mentioned strategy development I'll post a little about Monte Carlo simulations & backtesting. Once you have a set of metrics which do you use to compare apples with apples & not apples with oranges.

Let's talk about backtesting (the period selected)
Backtesting a lot of data can be a good thing but backtesting over a longer time frame, there is always the randomness of outliers skewing the results leading you down the path of changing the code to fit the randomness of outliers. Meaning, just be aware of the randomness of outliers before making any significant changes to your strategy.

It can mess with you (Monte Carlo is important)
Backtesting over a large data set "randomness" can mess with you & your strategy development. Concentrate on the Monte Carlo “Out Of Sample” (OOS) results & take much less notice of the Monte Carlo “In Sample” results.

It's important
Monte Carlo results can be a missing metric in the development of a strategy. In reality, outliers can falsely lead you down a path of strategy correction lowering the probability of returns when actively trading the system compared to your backtesting results. The more you learn the more you understand the importance of having statistical data to compare results. Monte Carlo Simulations adds randomness to the strategy by running several thousand simulations using different data points to compute the average of the results.

Microsoft Excel
Originally, I used Microsoft Excel to visualise this data from the Monte Carlo Simulations creating a histogram showing the minimum & maximum return. With that same data, I was able to create a "scatter plot" to show the average annual returns versus the maximum drawdowns. But from AmiBroker version 5.94 onwards, a Monte Carlo simulator is built-in to the backtest, saving you all this extra work.

The general idea behind Monte Carlo analysis
Monte Carlo Analysis is a process of validating the robustness of the Trading Strategy by performing multiple trials runs using a combination of positions from your trading system (backtested data). It's worthy to note "seasonality" automatically becomes part of the equation. You can use these statistics to analyse the characteristics of your trading system simulating a set of Equity curves using random numbers from the backtest data. These large sets of simulations are then used to find the likely probability of unseen risks in your trading strategy. The Monte Carlo Simulations "out-of-sample" (OOS) results are the true measure of the strategy. Why? because the strategy has been developed using "in-sample" data & is already known.

Monte Carlo Simulation
This process allows you to randomly select any number of Monte Carlo runs. I run either 100 or 1,000 runs all depending on how quickly I want to view the results. The more runs the more reflective the results will be. I prefer to use 1,000 runs which means 1,000 different trades from the original trade list. 1,000 runs are used to produce new random trades thus it's unlikely to pick the original "PostionScored" trades.

1,000 runs will give a random perspective of the robustness of your strategy
Understanding the robustness of your trading system helps identify any problem with your trading strategy. It's worthy to understand "Monte Carlo" analysis will not solve any problems. To put it in simple terms "Monte Carlo Simulation" is just a validation process, a tool to help you create a better trading system.

Interpreting the results
The results of the Monte Carlo simulations are displayed in the "Monte Carlo" tab of the Backtest report. At the top of the backtest results, the Monte Carlo tab displays a table that gives values of a few key statistics derived from the cumulative distribution charts.

Use the Search Feature
If you don't understand a particular terminology or simply want to know more use the "search feature" with "keywords" or phrase by "Skate". After 3422 posts in this thread, I've most likely posted about a range of questions you could think to ask. Lengthy answers might be what you are seeking but they become a pain for others to read.

Skate.
Skate, Thank you for the detailed reply, the explanations you have provided are greatly appreciated and have given me plenty to go on with.
Thanks for drawing my attention to the 'search' feature, had not thought of using it in this way.
 
Top