Australian (ASX) Stock Market Forum

Dump it Here

Added a new one this week AKE.

It's exciting to experience how other traders make their stock selection & the methodology that decides when a position is to be entered. My go-to is either the Monthly, Weekly or Daily "Ducati Blue Bar Strategy" to understand the reasoning a little better.

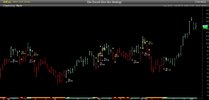
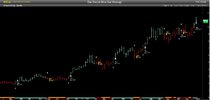
"The Ducati Blue Bar Strategy" is easy to understand as the first "Blue Bar" is the signal bar, meaning we enter the position on the next day at the open. We sell the position on the 2nd red bar as the first "red" bar is the signal bar.
The Blue Bar Strategy
This strategy has the unique ability to pick confirmed momentum of any security in any time frame. It displays the entry & exit points on the corresponding chart. The first coloured bar is the "signal bar" & the entry is at the opening of the next bar.

Choice of signals
Depending on the time frame, the signals vary. The three charts are for evaluation only to discern the difference a periodicity makes when trading.

AKE - Daily Chart
If you were trading a daily periodicity, the signals are shown on the chart below.

Daily AKE.jpg


AKE - Weekly Chart Signals
If you were trading a weekly periodicity, the signals are shown on the chart below.

Weekly AKE.jpg


AKE - Monthly Chart Signals
If you were trading monthly periodicity, the signals are shown on the chart below.

Monthly AKE.jpg


Summary
The periodicity you are trading determines the entry & exit positions on the charts. At times on a daily chart, an exit could be an entry on a weekly chart or vice-versa. The one thing about the "Ducati Blue Bar Strategy" it picks the optimal points (as far as the strategy is coded) no matter the period you elect to trade.

Skate.
 
can I please suggest a 30 weekly ema moving average. i find that stock moving above this line should be considered Bullish. Stocks below at a loss. This is probable as a long term position and i thought it may be something you would like to try as a support base line.

who knows how many people are now going to look at the 30wema

Having said that, I really don't think it matters a whole lot which MAs one uses. It is only an indicator after all.

Trading with an edge
An edge comes in many forms but it's all about consistency.

Trading Moving Averages
There has been some good banter on the "kiss-with-ann" thread that's worthy of a post.

This has got me thinking
Could we use a Simple Moving Average (SMA) or use an Exponential Moving Average (EMA) as a trading strategy. Using an (SMA) or (EMA) as a trading system was not suggested or implied. As an exercise, it would be interesting if we could enter & exit positions using a moving average. As a side note, the results below have money management & parameter setting to give the strategy (idea) a fighting chance. A Stale Stop, Trailing Stop & a TakeProfit Stop were all applied.

The backtest below is for the last 2 years that includes the COVID period.
(a) The backtest below on the left is trading a "200-Day Moving Average". Simply buy when the close is above the 200-Day Moving Average & Sell when the close is below the average.

(b) The backtest on the right is trading a "30-Week Moving Average". The strategy simply buys when the close is above the 30-Week Moving Average & Sell when the close is below it.

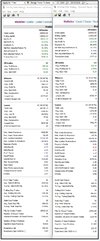
2 years Combined.jpg

What's the point?
Nothing really, it was a way of testing out a trading idea. Recently it's been suggested that I evaluate another trading idea developed by Peter Aan. It's another moving average trading strategy that uses a "Weekly high/low moving average". Peter Aan's idea is simple to a degree that I'll post about next using the same period as above.

Skate.
 
Trading Moving Averages
I've recently made a post about institutional traders moving large amounts of money in & out of the markets without shifting the price using moving averages. In the post, I could have worded the formula they use a little better. The formula is the MA of the "close" of the last 5 WEEKS (multiplied ) by the MA of the "volume" of the last 21 WEEKS - then filtered by momentum.


The backtest below is for the last 2 years that includes the COVID period (the same as above)

The results below uses a "5-Week MA" of the "close" (multiplied ) by the "21-Week MA" of the "volume" then filtered by momentum. Also, this strategy has money management & parameter setting to give the strategy a fighting chance. A Stale Stop, Trailing Stop & TakeProfit Stop were all applied to the strategy. I must say "the system drawdown" is well beyond my limits.

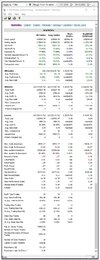
Weekly MaVol Strategy.jpg

Next Up
I want to explore Peter Aan trading idea using a 3-Week period using a "Weekly High/Low Moving Average". The results surprised me.

Skate.
 
3-period "Weekly High/Low Moving Average Strategy" by Peter Aan
A well-respected member passed on information as well as an article about a "3-Week Trading System" with a twist. Trend following seldom uses any variations of the popular "stock standard" moving average or (EMA) to give an indicator when the markets are buoyant let alone an idea for a stand-alone trading strategy.

Simple Moving Average
Moving averages are used to smooth prices & are widely used in various ways in technical analysis. To compute a simple moving average of five prices, for instance, add the five prices together & divide by five. That's the average over that period.

Most moving averages of price are based on the closing price
But here is the twist. Peter Aan suggests that you compute moving averages of the weekly highs & lows, based on the most recently completed calendar week. This is a very simple system. When weekly prices cross or "break" through either of the moving average levels, it is a signal to buy or sell. The rules of the system are straightforward. All I want to say is "don't let the simplicity of this system fool you".

Here's the simplicity
Because of the way the moving averages are computed, the buy & sell signals for a given week are a distance from each other that is approximately equal to the average weekly volatility for the period considered. This strikes a nice balance between many moving average systems, which can sometimes be whipsawed by rather small price movements to trigger signals & therefore, usually require large dollar risks per trade.

The backtest below is for the last 2 years that includes the COVID period (the same period as above)
The results below uses a "3-Week MA" of the "High" & the "3-Week MA" of the "Low" forming a channel equal to the average weekly volatility for the 3-Week period. I have money management & parameter setting to give the strategy a fighting chance. A Stale Stop, Trailing Stop & TakeProfit Stop were all applied to the strategy. I must say "the system drawdown" is well beyond my limits as well.

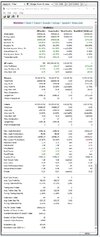
3-Period Moving Average Strategy.jpg

Summary
Would I trade any of the "Moving Average" systems I've posted about recently? Certainly not, but there are others who have a high-risk tolerance would.

Skate.
 
Trading Signals
There has been some good banter on the "kiss-with-ann" thread about the advantages of charting "Moving Average". @Ann has been posting positions of interest & @tech/a mentioned a couple that are high potential trades in his opinion, naming (BRN) & (CXO). Also to be fair he also remarked that "a 200 M/A is just an average of numbers means bugger all".

Positions (BRN) & (CXO)
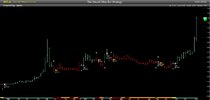
It's exciting when experienced traders suggest a stock selection. When a stock suggestion is made I use the "Ducati Blue Bar Strategy" to understand the reasoning behind the suggestion a little better. "The Ducati Blue Bar Chart" is easy to understand as the first "Blue Bar" is the signal bar, meaning we enter the position on the next day at the open. We sell the position on the 2nd red bar as the first "red" bar is the signal bar. (It's as simple as buying blue bars & selling red bars)
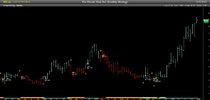
BRN weekly Chart
I'm not making a comment as the chart speaks for itself.

BRN.jpg


CXO weekly Chart
I'm not making a comment on this chart either as the chart speaks for itself.

CXO.jpg


Skate.
 
Lagging Indicators
I have to re-iterate that both the Simple Moving Average (SMA) & Exponential Moving Average (EMA) are lagging technical indicators. The Exponential Moving Average (EMA) uses calculations to smooth out the inherent lag time of the (SMA). In simple terms, both moving averages are a "graphic line" on a price chart, that's all.

3-Week High/Low Trading Strategy
First, you need to keep in mind that "moving averages" are not magical tools. But, by using two moving averages with the same period, follows the price strength with one simple twist. Defining the average of the lows & highs creates a zone, a band, or channel to use another phrase. Everything is simple with this strategy as we trade once we break above or below the 3-period band.

(BRN) used as the example
It's exciting when experienced traders suggest a stock selection & the 3-Week Moving Average Chart displays the buy position for (BRN) that @tech/a has suggested.

3 period BRN.jpg

Summary
Using the "Moving Average price band" combines the power of using multiple moving averages of the same periods but using different forms of calculations. This technique allows you to find unique trading opportunities that no one else is able to spot.

Skate.
 
Lagging Indicators
I have to re-iterate that both the Simple Moving Average (SMA) & Exponential Moving Average (EMA) are lagging technical indicators. The Exponential Moving Average (EMA) uses calculations to smooth out the inherent lag time of the (SMA). In simple terms, both moving averages are a "graphic line" on a price chart, that's all.

3-Week High/Low Trading Strategy
First, you need to keep in mind that "moving averages" are not magical tools. But, by using two moving averages with the same period, follows the price strength with one simple twist. Defining the average of the lows & highs creates a zone, a band, or channel to use another phrase. Everything is simple with this strategy as we trade once we break above or below the 3-period band.

(BRN) used as the example
It's exciting when experienced traders suggest a stock selection & the 3-Week Moving Average Chart displays the buy position for (BRN) that @tech/a has suggested.

View attachment 135733

Summary
Using the "Moving Average price band" combines the power of using multiple moving averages of the same periods but using different forms of calculations. This technique allows you to find unique trading opportunities that no one else is able to spot.

Skate.
But if you find unique trading opportunities no one else can spot, do you not go by definition against the trend?
Is not trend trading in essence trading with the masses?
Toying with you Mr Skate ?
 
But if you find unique trading opportunities no one else can spot, do you not go by definition against the trend?
Is not trend trading in essence trading with the masses?
Toying with you Mr Skate ?

Great comment
@qldfrog that's a great point about trading with the masses but using a 3-week average of the lows & highs creates a zone, a band, a channel to enter & exit a position. The simplicity of channel trading is that the channel is equal to the average weekly volatility for the period. I just hope this one point is not missed by anyone.

Hi Skate,
Is the WMA an opttion for use with that system?
Just wondering.
Great suggestion
@DrBourse that's a great suggestion worthy of more research. For others, what @DrBourse is suggesting is that we use the weighted average to form our 3-Week Moving Average Channel. A 3-Week weighted average gives a weight of 3 to the most recent week, 2 to the previous week & down to 1 for the third week for a 3-week lookback period. Using the (WMA) would be simple & clean.

Peter Aan suggests that you compute using a simple moving average of the weekly highs & lows, based on the most recently completed calendar week. I'm sure that the Doctors suggestion would be just as feasible. I reckon you could even use an (EMA) & trade the strategy as a pullback system.

Here's the simplicity
Because of the way the moving averages are computed, I'm positive you could use a variety of moving averages to create your own unique strategy that may give you an edge because no matter what version of moving averages you use you are trading in essence the average weekly volatility for the period.

Skate.
 
Hi again Skate.
Thought I should explain why I prefer The WMA over either of SMA or EMA.
Your above explanation is Spot On.
My explanation (pages 50, 80 & 81), is a pictorial explantion of why I always use the WMA.
1642115975465.png
1642116003523.png
1642116029546.png
Cheers.
DrB
 
Hi Skate,
Is the WMA an opttion for use with that system?
Just wondering.

Wonder no longer
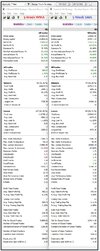
@DrBourse made a suggestion of using the weighted moving average to form a 3-Week Moving Average Channel rather than a Simple Moving Average Channel. Every metric across the range was worse than expected using (WMA). I've been racking my brain to understand why. The only reason I can come up with is the channel is no longer equal to the average weekly volatility altering the entry & exit points.
3-Period SMA - WMA Strategy.jpg

Summary
The suggestion was sound, assuming the entry & exit points would be more responsive but not so as exit positions were held longer increasing the drawdown & the losers holding period.

Skate.
 
Wonder no longer
@DrBourse made a suggestion of using the weighted moving average to form a 3-Week Moving Average Channel rather than a Simple Moving Average Channel. Every metric across the range was worse than expected using (WMA). I've been racking my brain to understand why. The only reason I can come up with is the channel is no longer equal to the average weekly volatility altering the entry & exit points.

View attachment 135763

Summary
The suggestion was sound, assuming the entry & exit points would be more responsive but not so as positions were held longer increasing the drawdown & holding period.

Skate.
M8, can I ask what term WMA you used - those results just do not make sense IMO
 
M8, can I ask what term WMA you used - those results just do not make sense IMO

I used the same 3-week period for both backtest.

A Stale Stop, Trailing Stop & TakeProfit Stop were all applied to the strategy. I must say "the system drawdown" is well beyond my limits as well.

Let me explain
(a) I re-coded your suggestion from scratch using the 3-Week (WMA) as the entry condition. For simplicity, I've used (WMA) as the Stale Exit. The strategy also includes a Trailing Stop & Take Profit Stop Exit to give the strategy every chance of success.

(b) My previous strategy was coded weeks before using the 3-week (SMA) as the buy condition & 3-Week SMA exit strategy as part of my Stale Stop exit wring the best performance out of it at the time.

Let me re-code both strategies so they are the same
In a few minutes, I'll recode both strategies using the same parameters & conditions for an equal comparison. I'm guessing restricting my Stale Stop Strategy to the (SMA) only will alter the performance.

Skate.
 
So I guess what I need to know is - Are you using A "Black Box Type System" where you are unable to select your own WMA Settings, or can you use a setting of say 7 or 10 or whatever you want to use - or is it just a case of Hit the Software Prog's WMA Button and then hope for the best ?
 
So I guess what I need to know is - Are you using A "Black Box Type System" where you are unable to select your own WMA Settings, or can you use a setting of say 7 or 10 or whatever you want to use - or is it just a case of Hit the Software Prog's WMA Button and then hope for the best ?

@DrBourse my strategy is coded from scratch. The (WMA) & (SMA) are Amibroker built-in functions. The Amibroker (WMA) function calculates the weighted average for the selected period. I can use any period for either function. Peter Aan original suggestion was that you compute moving averages of the 3-weekly highs & lows, based on the most recently completed calendar week. I strictly adhered to that period for the exercise. I'm not suggesting that this is a tradable strategy, far from it in its current form but rather throwing the idea out there for others to think about how other traders garnish an edge that at times is easy.

Skate.
 
OK, so unless you can select your own "weighted average setting for the selected period", then it's a "BB System", Dangerous to say the least - I have always avoided BB Systems.

With all Software Trading Platforms, the crucial thing is that the user "Must be able to Drive EVERYTHING", otherwise we have no idea how their formulas are constructed.
That is, they could be built so that the Software gives a result desired by those that constructed it in the first place.
In other words, they could have programed the WMA to always show results that are below the Black Box Systems favoured EMA & SMA.

Years ago I challenged a couple of BBSystem Providers, they all refused to explain their "in house formulas" - anyone with an enquiring mind would have to as 'WHY the reluctance to be truthful'.

Count me out of this discussion, Personally I would not place any creedence in any of their results.

Sorry M8
 
Last edited:
Here we go
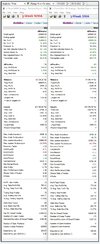
Both strategies are now using the same parameters & conditions for the buy & sell that give a direct comparison. Comparing apple to apples certainly makes a difference.

I've been racking my brain to understand why. The only reason I can come up with is the channel is no longer equal to the average weekly volatility altering the entry & exit points.

I've been racking my brain to understand why
Now I know the reason, it was because my original strategy has my "Stale Stop Exit" included in the strategy. My original strategy incorporated my "Stale Stop Exit" whereas the strategy coded with @DrBourse suggestion didn't have it included as his idea was re-code from scratch. The 2-year backtest results are not that far apart.

3-Period comparison SMA - WMA Strategy.jpg

Summary
Note to self, keep using the original "Stale Stop Exit" as it exits a position sooner, rather than later.

Skate.
 
But you still cannot Select your own "weighted average setting eg: 7, 10, 20 , 30, 50 200 etc", correct ?
But you can choose you own "Selected Period", correct ?
Strange to say the least M8.
Think I'll leave that BB System to the Sheep of this world.
So, I hope the Sheep use it the way it's designed to be used, it will make my job easier, because I reckon they are Barking up the Wrong SHEEP".
 
OK, so unless you can select your own "weighted average for the selected period", then it's a "BB System". With all Software Trading Platforms, the crucial thing is that the user "Must be able to Drive EVERYTHING", otherwise we have no idea how their formulas are constructed.

But you still cannot Select your own "weighted average setting eg: 7, 10, 20 , 30, 50 200 etc"

@DrBourse if I may. So others don't get the wrong impression I'll supply the 8 lines of code (from the 1178 lines of code used in the strategy) to better explain how the 3-week High/Low Strategy has been coded. I have used the "Param Function" in my code so other lookback periods can be selected without recoding the entire strategy. Maybe the sticking point is that Amibroker has the (WMA) as a built-in function.

For transparency
The raw Amibroker code that I have used is supplied below. Also, the hyperlink & Amibroker reference is also supplied for a better understanding of how Amibroker (WMA) function is coded.

#1. WMA Buy & Sell Condition
Periods1 = Param("Periods1",3,1,750,2);
Periods2 = Param("Periods2",3,2,750,2);

WMA1 = WMA(H,Periods1);
WMA2 = WMA(L,Periods2);

BuyFilter2 = C > WMA1;
SellFilter2 = C < WMA2;

BuySetUp = BuyFilter2 AND WeeklyFilters AND NOT OnLastTwoBarsOfDelistedSecurity AND NorgateIndexConstituentTimeSeries( "$XAO.au" );
StaleStopExit = SellFilter2 OR OnSecondLastBarOfDelistedSecurity;

OR

#2. SMA Buy & Sell Condition

Periods1 = Param("Periods1",3,1,750,2);
Periods2 = Param("Periods2",3,2,750,2);

SMA1 = MA(H,Periods1);
MA2 = MA(L,Periods2);

BuyFilter2 = C > MA1;
SellFilter2 = C < MA2;

BuySetUp = BuyFilter2 AND WeeklyFilters AND NOT OnLastTwoBarsOfDelistedSecurity AND NorgateIndexConstituentTimeSeries( "$XAO.au" );
StaleStopExit = SellFilter2 OR OnSecondLastBarOfDelistedSecurity;

For those who have Amibroker

WMA
- weighted moving average​

Moving averages, summation
(AmiBroker 40)​

SYNTAXwma( ARRAY, periods )
RETURNSARRAY
FUNCTIONCalculates weighted average. 5 day weighted average gives weight of 5 to the most recent quote, 4 to the previous quote, down to 1 for the 5-bar back quote. The function accepts time-variable periods.
EXAMPLEWMA( Close, 5 )

Skate.
 
Top