Australian (ASX) Stock Market Forum

Dump it Here

For those who are aware of or follow Lyn Alden's research and commentary, her January newsletter is just spot on, great read.

I would certainly agree that her research is good.

A topic that she hasn't touched on however, the withdrawal of QE (Taper) on stonks.

QE is the purchase of $120B/month of bonds/MBS from commercial banks. The money the banks use to purchase Treasury debt and/or grant mortgages is created ex nihilo. This 'money' (fiat currency) sits on the liability side of the bank's balance sheet. The purchased asset, on the asset side of the balance sheet. When the asset is sold to the Fed. the bank's ledger at the Fed is credited with the sale price (at par) of the bond.

This asset can be drawn down, which it is, and a purchase of a new asset stonks, replaces the sold bond on the bank's balance sheet as an asset balancing the liability of the cash created originally.

That is $120B/month of equity (mortgage) support that goes to zero in Fed. 2022.

As Ms Alden indicates, the US economy has been financialised over a number of decades, ie. the stonk market is the economy.

If the stonk market declines by (pick a number) 20%, what will the Fed do?

(a) Nothing and continue to raise rates;
(b) Re-instigate QE, lower rates back to ZIRP and in real terms deeply NIRP?

Both answers result in chaos.

(a) Results in mass bankrupticies, and massive deflation a la 1930's style of corporations and eventually the government, which cannot pay its liabilities outside of currency creation. This inflationary pressure offsets to a degree the deflationary pressures.

(b) Results, eventually in the (hyper) inflationary destruction of DXY and by extension, all other fiat currencies.

I 'think' the Fed will choose (b). Either choice is horrible.

jog on
duc
 
People’s personal approach will often dictate what system metrics are important to them
The re-coding of the original Moving Average Strategy was slight but extremely time-consuming

Kaufman's Adaptive Moving Average (KAMA)
Before finishing off the series of posts about trading Moving Averages it would be remiss of me not to include another unique type of moving average being the "Kaufman's Adaptive Moving Average" (KAMA) that's been suggested by the same member to explore. I was supplied the Amibroker code but decide to bring my old "KAMA Strategy" & give it another burl using my coding instead.

Lagging vs Leading Indicators & How To Use Them
There is a short video to explain the differences between the SMA EMA KAMA & MAVs that I will post shortly on how to put these indicators to best use in your trading systems. But before I do I would like to make a few remarks about Kaufman's Adaptive Moving Average (KAMA) in particular. Understanding the difference between lagging & leading Indicators means you can develop trading strategies that work more reliably in today's uncertain markets.

Skate.
 
I've recently posted about three "Moving Averages" being the SMA, EMA & WMA
There is a fourth to add to the list of moving averages being Kaufman’s Adaptive Moving Average "KAMA" so you can compare the lagging/leading nature & consider if they can be adapted in your trading system to give you that elusive trading edge. The (KAMA) indicator is handy because of its unique character of indicating the market trend & volatility.

If you don't know it, we all trade trends
As traders, we all “make a decision” on the basis that future trends will continue to develop in the same direction as the past trends. Like all moving averages, the KAMA shines head & shoulders over all the others (IMHO) & it can even be used for support & resistance levels.

There are so many questions

How do we get into a new trend?
How do we know if a trend is trending nicely?
How does one quantify a trend?
How does one work out the quality of a trend?

Skate.
 
Alternative uses for the KAMA indicator
The KAMA indicator can be used to identify existing trends, & impending trend changes. Knowing when a trend is changing you can take advantage of the reversal points to enter or exit a position.

How do we use the KAMA indicator?
Basically, the uses are unlimited or limited only by your imagination & research. A simple way would be to use the KAMA line (that is simple to plot on a chart). When the KAMA indicator "line" is moving lower, it indicates the existence of a downtrend & when it’s moving higher, it shows an uptrend. Compared to the Simple Moving Average, the KAMA indicator is less likely to generate false signals that may cause a trader to incur losses.

Skate.
 
Here is the secret - the "KAMA" is an adaptable indicator
The KAMA indicator can be used in a few different ways by coding two sets of KAMA parameters & using the crossing of the lines to trigger signals. For example, when the faster KAMA line crosses above the slower KAMA line, this indicates a change from a downtrend to an uptrend. The KAMA signals are faster than both (SMA or EMA).

The KAMA Parametres that I use
I use a standard 10-period look back with a fast period of (2) & a slow period of (30). These parameters are not set in stone as they are dependant on other parameters & filters, but it's a starting point for those who want to do additional research & backtesting.

The KAMA indicator can easily be applied to a chart
Customizing the indicator by specifying its parameters for its calculation & these changes allows you to analyse the behaviour to predict future price movement. One of the uses of Kaufman’s Adaptive Moving Average is to identify the general trend of current market price action.

Skate.
 
A must watch Video
There is a short YouTube video where Martyn Tinsley explains the differences between a range of moving averages (SMA, EMA, KAMA) - it's well worth watching even if you are a seasoned trader. The KAMA indicator is discussed at the 10:15 minute mark for those who are time-poor.


Skate.

I've tried a lot of different MAs over the years but admittedly in the context of an index filter. Overall I keep coming back to the old fashioned simple MA as it seems to be the most robust across a range of different markets.
 
I've tried a lot of different MAs over the years but admittedly in the context of an index filter. Overall I keep coming back to the old fashioned simple MA as it seems to be the most robust across a range of different markets.

@MovingAverage that's fair enough, each to their own. Up next, I was going to make a series of posts about something that's really exciting but as I was given the information in private it would be best left for others to research. The information was supplied by the same member as before who suggested I research how to use "Perry Kaufman's Efficiency Ratio" & how to apply it to any strategy.

"Perry Kaufman's Efficiency Ratio"
In my humble opinion, the Efficiency Ratio "ER" may just be the perfect trend indicator that can be used in any timeframe. I also thank him for the Amibroker code & reference material that has been kindly supplied.

Skate.
 
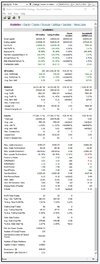
KAMA Strategy 2 year backtest
As I have posted previous results of a "3-Week MA Strategy". It's only fair that I code a "3-Week KAMA Strategy" using Kaufman's Adaptive Moving Average (KAMA) without any fancy footwork in the background. I'm absolutely positive changing the standard parameters would have a positive bearing on the results.

1. Combined KAMA Strategy.jpg

Summary
The backtest above was to indicate the results using Kaufman's Adaptive Moving Average (KAMA) in its raw form instead of a Simple Moving Average (SMA). I do have a KAMA Strategy that I haven't used for quite some time, I dig it out & do a comparison. My KAMA strategy would have been refined before placing it away. From memory, I called it "White Kama"

Skate.
 
Crikey Batman
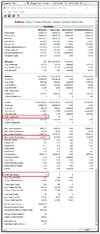
I now know why I didn't have the guts to trade this strategy. Back when this strategy was being developed I never had a "Take Profit Stop" by default. As I use it in every strategy I trade these days I'll post a backtest with one active for comparison.

White KAMA Strategy with no "Take Profit Stop"
2 year Backtest

a. Combined White KAMA Strategy.jpg


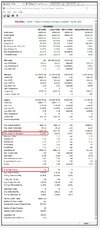
White KAMA Strategy with a "Take Profit Stop" by default
2 year Backtest

1. Take Profit Stop Combined KAMA Strategy.jpg

Summary

With added knowledge since this strategy was developed, I may be able to get the drawdown to a tolerable level. I'll put it on my To-Do list.

Skate.
 
@MovingAverage Up next, I was going to make a series of posts about something that's really exciting but as I was given the information in private it would be best left for others to research.

What…then why say anything at all?
 
@MovingAverage Up next, I was going to make a series of posts about something that's really exciting but as I was given the information in private it would be best left for others to research.

What…then why say anything at all?

@MovingAverage I was going to condense a complex subject on "Kaufman's Efficiency Ratio" so others could understand. The most recent series of posts about trading a variety of different types of moving averages didn't really appeal. I even supplied the code for further research. There would be some who didn't completely understand how the different moving averages could be used in multiple ways.

SMA, EMA, WMA & KAMA
This group of moving averages all have their advantages. As I've done extensive research on Kaufman's Adaptive Moving Average (KAMA) & by doing a few posts on the subject would finish off the series about trading moving averages. I'm sure some wouldn't share my enthusiasm for trading these styles so I supplied a video & time stamp for those who wanted to understand the "KAMA" a little better.

"Perry Kaufman's Efficiency Ratio"
In my humble opinion, the Efficiency Ratio "ER" may just be the perfect trend indicator that can be used in any timeframe. I was intending to do a series of posts on Kaufman's Efficiency Ratio & explain how this "trend indicator" could be used & coded adding "spice" to any trend following strategy. It takes a great deal of time to do a series of posts in such a way as to spark the interest of others. I'd bet pounds to peanuts not many would have taken the time to comprehend the code I supplied for the SMA & WMA Buy & Sell Condition, let alone the parameters I use in the KAMA Strategy.

Lets us not bore others to death
So instead of doing a series of posts & backtests on the Kaufman's Efficiency Ratio, I thought it would be better for those who are interested to do their own research on the "ER". I constantly post information that inspires my research but I fully realise it's repetitive & also a chore to read at times.

Skate.
ER helps a lot, even without covid :) , added it to a mixbag system on weekly XAO with full history and behaving quite well
 
SMA, EMA, WMA & KAMA
This group of moving averages all have their advantages. As I've done extensive research on Kaufman's Adaptive Moving Average (KAMA) & by doing a few posts on the subject would finish off the series about trading moving averages. I'm sure some wouldn't share my enthusiasm for trading these styles so I supplied a video & time stamp for those who wanted to understand the "KAMA" a little better.

Just a personal opinion and not a reflection of your post. MA's certainly have a place, but using them to directly generate buy/sell signals using the vanilla crossover approach is certainly tough. By their very nature, they get you into trades late, get you out of trades late and you get whipsawed everywhere with the slightest hint of volatility. Appreciate there are many different types of MAs but generally all of them suffer from these problems--some MAs might prove marginally better than other MAs but they all have the same problem.

"Perry Kaufman's Efficiency Ratio"
In my humble opinion, the Efficiency Ratio "ER" may just be the perfect trend indicator that can be used in any timeframe. I was intending to do a series of posts on Kaufman's Efficiency Ratio & explain how this "trend indicator" could be used & coded adding "spice" to any trend following strategy. It takes a great deal of time to do a series of posts in such a way as to spark the interest of others. I'd bet pounds to peanuts not many would have taken the time to comprehend the code I supplied for the SMA & WMA Buy & Sell Condition, let alone the parameters I use in the KAMA Strategy.

For what it's worth, if you believe the Efficiency Ratio is a good trend indicator I'd love to see how it stacks up against the SMA when used as an index filter. Folks (including myself) like using the SMA as an index filter--it's simple and reasonably effective for that purpose but I do believe there is room for improvement in this area.

Lets us not bore others to death
So instead of doing a series of posts & backtests on the Kaufman's Efficiency Ratio, I thought it would be better for those who are interested to do their own research on the "ER". I constantly post information that inspires my research but I fully realise it's repetitive & also a chore to read at times.

Skate.

You can please some of the people some of the time but not all the people all the time. You just have to post and if some find it repetitive and a chore to read then folks can just scroll on by :xyxthumbs
 
@MovingAverage I was going to condense a complex subject on "Kaufman's Efficiency Ratio" so others could understand. The most recent series of posts about trading a variety of different types of moving averages didn't really appeal. I even supplied the code for further research. There would be some who didn't completely understand how the different moving averages could be used in multiple ways.

SMA, EMA, WMA & KAMA
This group of moving averages all have their advantages. As I've done extensive research on Kaufman's Adaptive Moving Average (KAMA) & by doing a few posts on the subject would finish off the series about trading moving averages. I'm sure some wouldn't share my enthusiasm for trading these styles so I supplied a video & time stamp for those who wanted to understand the "KAMA" a little better.

"Perry Kaufman's Efficiency Ratio"
In my humble opinion, the Efficiency Ratio "ER" may just be the perfect trend indicator that can be used in any timeframe. I was intending to do a series of posts on Kaufman's Efficiency Ratio & explain how this "trend indicator" could be used & coded adding "spice" to any trend following strategy. It takes a great deal of time to do a series of posts in such a way as to spark the interest of others. I'd bet pounds to peanuts not many would have taken the time to comprehend the code I supplied for the SMA & WMA Buy & Sell Condition, let alone the parameters I use in the KAMA Strategy.

Lets us not bore others to death
So instead of doing a series of posts & backtests on the Kaufman's Efficiency Ratio, I thought it would be better for those who are interested to do their own research on the "ER". I constantly post information that inspires my research but I fully realise it's repetitive & also a chore to read at times.

Skate.
Not boring at all! Keep the posts coming
 
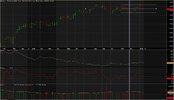
As a general rule I don't bother with charts, but I have been watching XAO over the past few months because one of my systems is breakout based. If you're a system breakout trader you might be interested. What I've done below is overlaid a standard regression channel (shown in the while dotted lines) on the XAO weekly chart. The upper and lower lines are placed at 2 standard deviations from the middle regression line. Poor old XAO has just been bouncing off the upper and lower 2SD lines since Jun/July last year. Given where XAO currently sits within that channel I don't think us poor breakout traders will be seeing any joy soon. XAO hasn't seen this type of protected sideways movement before, but think we'll need to see a full bar out side the upper 2SD level (7881) before we can start getting excited about our breakout systems getting into gear.

breakouts.JPG
 
Not boring at all! Keep the posts coming

@othmana86 I can guarantee you lengthy posts are a pain to read but sometimes the subject matter won't allow me to post in bite-size. I'll only make one post so others can understand why I believe the Efficiency Ratio "ER" may just be the perfect trend indicator that can be used in any timeframe.

Kaufman’s Efficiency Ratio (ER)
Efficiency Ratio is calculated by dividing the price change over a period by the absolute sum of the price movements that occurred to achieve that change. The resulting ratio ranges between 0 and 1 with higher values representing a more efficient or trending market.

The mathematical genius of Kaufman
When prices move in wide swings within the lookback period, the sum of the denominator becomes very large compared to the numerator, & ER approaches zero. A trend is considered “persistent” only when RE is above a certain value, of (0.3 or 0.4) while choppy markets have ERs closer to Zero (0)

These are the parameters I've decided on

ER Parameters.jpg

Summary
The Kaufman Efficiency Ratio provides a simple method to quantify market noise. In other words, it gauges how smoothly prices are moving from one level to another. This indicator is a great way to determine when your systematic trading system might be losing its edge. When the noise in prices becomes too high, you will start seeing weaker trends & vice versa. Using this indicator helps determine when a trend is strong. It pays to remember, the “trend is your friend”.

Skate.
 
SMA, EMA, WMA & KAMA
This group of moving averages all have their advantages.

The "KAMA" is an adaptable indicator
Before I move on from "moving averages" I should mention that Amibroker has its own adaptive moving average built-in (AMA) function. (AMA) calculates the adaptive moving average similar to (EMA) but the smoothing factor could be time-variant (array).

More information can be found here:
AFL Function Reference - AMA (amibroker.com)

AMA2 – is also an adaptive moving average with a twist
The (AMA2) function calculates adaptive moving average similar to (AMA) but the (AMA2) has a twist with separate control of "feedbackfactor".

More information can be found here:
AFL Function Reference - AMA2 (amibroker.com)

Skate.
 
Moving averages are usually thought of as a trend-following tool
That traditional thinking fails to take advantage of the moving average’s ability to pinpoint extremes in price that you can customise making it one of the best fall-back exit plans around.

MA's certainly have a place, but using them to directly generate buy/sell signals using the vanilla crossover approach is certainly tough.

What is the best way to trade moving averages?
We all have different personalities, risk tolerances, beliefs, & biases that dictate the approach we take when trading moving averages. Finding a method that you can stick with & execute the signals without hesitation with confidence is the key, assuming your strategy has a real edge.

Skate.
 
Top