Australian (ASX) Stock Market Forum

Dump it Here

So @Skate

This chap has an interesting take: https://www.olivermsa.com/msa-methodology.html

Now I have no idea if this could be coded. For obvious reasons he does not go into detail on how he does it. I have created a copy cat using his basic thesis, which if you are interested I can PM you on.

jog on
duc
Well, my interpretation goes something like this:

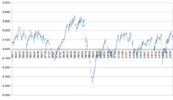
Actual monthly bars are compared to the 36 month moving average, and the price data is converted into a percentage away from that 36 month moving average. So, in effect, you have a data series which is moving about the mean. A very good candidate for a mean reversion system.

Now, I am terrible at Excel charts, so please excuse the poor quality (can't figure out how to change the X axis), but this is what a chart of XJO would look like using this bloke's system. The chart contains monthly data from July 1996, up to and including today's close.

Screenshot (11) - Copy.png
Just for some context, the first drop below the X Axis is June 2002, then March 2008, and the most recent high is August 2021. And, by the looks of things .... we're on the way down. Sorry, but I can't get the chart any better ... I need a lesson in Excel Charts.

KH
 
There you go, a little clearer. At least on this one you can read dates.

Remember, this is very long term. Monthly bars moving around a 36 month moving average. The data series will always move back to the long term moving average, which is shown here as 0 (zero), the X axis.

Screenshot (11).png

KH
 
There you go, a little clearer. At least on this one you can read dates.

Remember, this is very long term. Monthly bars moving around a 36 month moving average. The data series will always move back to the long term moving average, which is shown here as 0 (zero), the X axis.

View attachment 133155

KH
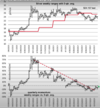

This is what Mr Oliver's charts look like:

Screen Shot 2021-11-20 at 6.06.50 AM.png

jog on
duc
 
Food for thought
I've been reviewing my backtest and trade stats (which I am more than comfortable with) and listening to a lot of trend following podcasts and I have picked up on some interesting opinions that I will share with you. Specifically in respect to trend following, if one of the main tenents of trend following is to let our open trade profits run to allow us to hunt down outlier trades that make most of the systems money, why are we so concerned with drawdowns from equity highs when those drawdowns from equity highs could simply be fluctuations of open trade profits which we need to let move, to find those outlier trades?

Comments pulled from Chartist website
"Momentum is a logical, time-tested approach supported by vast amounts of academic and industry research gathered over many decades. Stocks that have done well recently tend to continue doing well in the following months and even years. This strategy specifically targets Large Cap stocks that are outperforming their peers, although it can be used on any universe of stocks. The strategy trades just once a month. The strategy allows users to generate buy and sell signals, run backtests and adjust a myriad of parameter settings without needing to understand coding. Other filters include price, volume, turnover, market regime and two position sizing modes"

@Cam019 that's an interesting concept (monthly periodicity trading)
As both @Cam019 & @Warr87 have purchased the Chartist Large Cap Momentum turnkey strategy has me thinking about a few points.

(a) Would the strategy perform using the ASX All Ordinaries with 10-position Portfolio?
(b) The idea promoted by @Cam019 to "let your open trade profits run", is the logical conclusion sound?
(c) On the flip side, would the drawdown be beyond the limit that you could stomach before reaching for the spew bucket?

I HAVE MODIFIED THE PARAMETERS OF THE ORIGINAL TURNKEY STARTEGY TO SUIT MY RISK TOLERANCE. MY RESULTS WILL DIFFER FROM THAT OF THE ORIGINAL SOURCE CODE.
So, to be crystal clear, like @Warr87 I will not be the using the Large Cap Momentum turnkey strategy in its original form. I will be using my slightly modified version of it. I have been able to make some minor adjustments which means the following:
I have increased my CAGR by 30.58%
I have increased my maxDD by 46.61%

My new monthly momentum system that will be traded on the ASX300 universe. I have chosen to run my system on the ASX300 and not the ASX100 like Radge. I will also be using 10 positions, not 5. I am not running a filter. My system in comparison may be riskier than Radge's.
Now points to consider
(a) Momentum happens in all periodicities.
(b) Nick said, "Stocks that have done well recently tend to continue doing well in the following months and even years".
(c) Nick also said, the "Momentum Turnkey Strategy" targets "Large Cap stocks" that are outperforming their peers

It's got me thinking
The "Momentum Turnkey Strategy" is a monthly momentum strategy & after reading the comments made by @Cam019 & @Warr87 my interest has been sparked. Trading monthly requires little work & if the results are only viewed once a month it would lower the stress involved as well.

I've coded a 10-position monthly momentum strategy
In the next post, I'll display a few backtests so the returns can be viewed. I've included the metrics that I can capture on the screen.

Skate.
 
Skate's Monthly Momentum Strategy
The strategy is a $100k, 10-position portfolio ($10k bets)

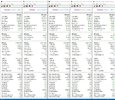
The backtest reports from left to right:
1. 20th November 2016 to today (5 years)
1. 20th November 2017 to today (4 years)
1. 20th November 2018 to today (3 years)
1. 20th November 2019 to today (2 years)
1. 20th November 2020 to today (1 year)

Momentum Backtest 2015 up.jpg


Observations
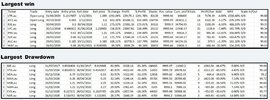
The performance is respectable & trade frequency is low. Now let's review the 8 largest wins & compare them to the 8 largest drawdowns.


Cmparison.jpg


Summary
If you are prepared to accept the occasional large individual drawdown it would be a tradeable strategy. But if you are "the type" that views your results on a daily basis I'm sure you would find it extremely difficult to refrain from selling positions mid-stream.

Skate.
 
Very interesting.

Shouldn't that be ASX300 or ASX200 if trading large caps Skate? One would expect much greater liquidity (only an issue for very large accounts), probably lower returns, and hopefully lower volatility if trading a "larger cap" universe than ASX500?
 
Very interesting.

Shouldn't that be ASX300 or ASX200 if trading large caps Skate? One would expect much greater liquidity (only an issue for very large accounts), probably lower returns, and hopefully lower volatility if trading a "larger cap" universe than ASX500?
Nick said, the strategy specifically targets Large Cap (ASX100) that are outperforming their peers, although it can be used on any universe of stocks.

@Newt, trading large caps strangles returns. Neither @Cam019 nor @Warr87 is trading the (ASX100). Warr has stated that he is trading the (ASX300) index that has more volatility. The All Ordinaries has more volatility again & that volatility is smoothed over a month. With a momentum strategy, the periodicity is of no concern. Trading with small ($10k) bets liquidity is not an issue.

It happens naturally
@Cam019 has the idea to let "your profits run" at the expense of a larger drawdown. His idea is sound but his maximum Draw Down of 46.61% is not palatable. There is always a fine line between "profits & drawdowns". When seeking larger returns, unfortunately, increases the drawdowns. What I consider to be the "Goldilocks" trade-off, others will have a different view in relation to their own risk tolerance.

Skate.
 
I agree - any work I've done on ASX200 and 300 (or similar) rarely seems worth the benefit - less return, similar DD risk - assuming proper position sizing and risk measures. For weekly TF, the FPO and XAO universes seem adequate - and possibly a niche that is too small to interest many sophisticated large investment operations.

Just curious what others had experienced.
Actually it is something that surprised me:
DD on XAO and FPO are quite similar, while potential gains higher on FPO.
But to handle carefully as FPO often hard to buy sell at open due to smaller market
 
Last edited:
Actually it is something that surprised me:
DD on XAO and FPO are quite similar, while potential gains higher on FPO.
But to handle carefully as FPO often hard to buy sell at open due to smaller market
Apologies i mixed up my initial answer FPO better BT on most of my systems..but designed for FPO so no surprise
 
Yes, sorry Peter. Should have explained, but Rob already has.

One challenge with the full Norgate platinum subscription is defining what will go into that "fully paid ordinary" universe and there is quite a lot of granularity to include or exclude stapled securities, etc.
 
Yes, sorry Peter. Should have explained, but Rob already has.

One challenge with the full Norgate platinum subscription is defining what will go into that "fully paid ordinary" universe and there is quite a lot of granularity to include or exclude stapled securities, etc.
Yes differences between Premium Data FPO ( they "created" that subset of the asx market) and what we can reproduce in NDU (Northgate data)
In a nutshell, FPO includes much more than XAO:
usually ,and from memory,
around nearly 3000 stocks.so all your micro caps etc or seen differently a lot of garbage too? but in the worlf of million dollars meme JPEGs...
actually less than I thought, I just checked 1232 stocks as of this weekend..so XAO +
 
(c) On the flip side, would the drawdown be beyond the limit that you could stomach before reaching for the spew bucket?
I think this is only an issue if we look at drawdowns as something we must try and limit or avoid. I prefer to reframe drawdowns as a combination of actual closed trade equity drawdown and open trade equity fluctuations. The open trade equity profits aren't mine as I haven't closed the position and the only way to catch large outliers, which will increase my CAGR over time, is to let those open trade profits fluctuate.

As trend followers we might look at a chart of a stock and accept that the stock won't go up in a straight line and therefore, we need to accept some profit giveback in order to catch the overall larger trend. I remember listening to a CWT podcast with Nick where he talks about a dymanic trailing stop - 40% when regime filter is up, ratcheting up to 10% when the regime filter turns down. Well, I see my equity curve as the same type of thing. My equity curve isn't going to go up in a straight line, it will zig and zag, it will pull back, it will consolidate and go sideways, however if I stick to my system and take the trades my system tells me to, I can expect that I will create the longer term up trend of my equity curve, albiet with short to medium term return volatility.

I need to give my equity curve room to move in order to create the long term trend of my equity curve.

It's so interesting to me that the focus is on reducing drawdowns and not maximising returns. I know everybody has different risk tolerances and capital preservation definitely becomes an issue the closer we get to retirement, however I am sceptical of these short term backtests showing incredible returns with minimum to minuscule drawdowns. @Skate the monthly systems are not run on monthly data as shown in your backtest results.

So, I ran the system I will be using in my SMSF, which is a modified version of Nick's 'Large Cap Momentum' strategy on the XAO with a maximum of 10 portfolio positions and we get the following results:

Backtest period: 01/01/1993 - 21/11/2021
CAGR: 37.13%
MaxDD: -62.84%

This is the most interesting bit for me and one of the reasons I stuck with the ASX100.

3.JPG

In April of 2000 you had to put up with a -51.9% month. I know people are going to say it doesn't matter because that was over 20 years ago - but it does matter because it is a result that the system has produced before which means it is now within your systems expected results.

@Newt, trading large caps strangles returns.
Actually, my testing shows that for this strategy, the thing that strangles returns the most is the using a regime filter.

Neither @Cam019 nor @Warr87 is trading the (ASX100).
I am trading the ASX100 for my SMSF system.

@Cam019 has the idea to let "your profits run" at the expense of a larger drawdown. His idea is sound but his maximum Draw Down of 46.61% is not palatable. There is always a fine line between "profits & drawdowns". When seeking larger returns, unfortunately, increases the drawdowns.
Once again, I think if you're taking the view that open trade profits are yours and you're trying to defend every equity high, then you're going to have to problems living with drawdowns.

Here is a question for everyone concerned about defending equity highs. When you position size, do you do it off original equity plus/minus closed trade profits and loses only or do you position size off your open trade profits as well?
 
Last edited:
Top