Australian (ASX) Stock Market Forum

Dump it Here

The other thing that I’ve only mentioned once on the forum, and I think that may have been in a conversation, is that I intend on trading the A$-US$ as another market in this system, to act as a currency hedge. The difference is it wouldn’t really be a hedge because a hedge is something you lose money on, it will be a trade to make money and provide a currency hedge while doing it. I hope this post fills in any questions like ‘what the f* is this guy talking about’.


Currencies can be tricky.
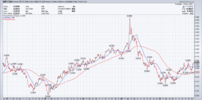
Screen Shot 2021-11-17 at 11.07.26 AM.png

The point though was more related to 'hedges'.

Hedges, if correctly implemented, are value adding (additive) to portfolios over time. Mark Spitznagel has a recent book on this subject (Safe Haven).

I would argue that at current valuations (Stocks, Bonds) hedges are critical to mitigate the really elevated risks generated from extended valuations and the current macro-environment.

There are (obviously) a number of ways of adding hedges to your portfolio.


jog on
duc
 
Sometimes you feel like dumping stuff & this thread might be the perfect place.

Helping Others
You might want to dump stuff here to help others

Unload
You might want to unload & dump something off your chest

Gems
You might even want to dump some gems here

Let it go
Sometimes you can't let somethings go till you dump it on paper

Dump it here
If you want to dump it, dump it here

Skate.
I am a newbie here, just trying to navigate my way in this Forum. Following Dr B's direction. Just read post n liking it.
 
I am a newbie here, just trying to navigate my way in this Forum. Following Dr B's direction. Just read post n liking it.

@Rabbithop thank you for your kind words, I'm glad you are liking what you are reading. I was chuffed to read @DrBourse referral, personal recommendations (that I appreciated) carry so much more weight. There is also a free eBook on offer in (ePub) format to download so you can read it on an iPhone or iPad. To read it on other phones or your laptop you need to have an "ePub reader" installed which is a free app.

The "Dump it here" thread is an exhausting read & requires a big commitment
The alternative site below is for others who want to read a snappier version of some of the things I want to say.


Welcome aboard.

Skate.
 
I have many year’s experience in the markets

@DaveTrade when the advice comes from experienced forum members such as @ducati916 - agree or disagree - when he speaks we should all act like a Psychiatrist and say: "Tell Me More".

It's sad to say
"Quality posts are getting thinner these days".

Duc's daily post always include the musings of Mr flippe-floppe-flye
Not only are the posts written by "Mr flippe-floppe-flye" a joy to read but his particular unique & amusing style are chock-a-block full of valuable information. None more so than this short passage.

"Follow trends best we can and consider counter-trends to be something of an anathema. I have traded in almost every way imaginable and can easily punch out 15% daily gains if concentrated in degenerate stocks. But, at least in my experience, it always evens out and the tortoise rarely loses to the hare. Heed my advice young Fly and don’t think you know more than the all knowing market".

Skate.
 
@Rabbithop thank you for your kind words, I'm glad you are liking what you are reading. I was chuffed to read @DrBourse referral, personal recommendations (that I appreciated) carry so much more weight. There is also a free eBook on offer in (ePub) format to download so you can read it on an iPhone or iPad. To read it on other phones or your laptop you need to have an "ePub reader" installed which is a free app.

The "Dump it here" thread is an exhausting read & requires a big commitment
The alternative site below is for others who want to read a snappier version of some of the things I want to say.


Welcome aboard.

Skate.

Just read through the past 20 or so pages of Skate’s “Dump it Here Forum”, lots of in-depth, valuable & educational posts on Market Software Systems, Back-testing, etc, so I thought I would join the discussions with a few observations of my own journey over the past 35/40 years.


Wannabe Share Traders venture into the Share Trading Sandpit for various reasons, those reasons are way too numerous to document here.

HOWEVER, I would like to say that the one WRONG REASON is, IMO, when the Wannabe joins the Share Trading World just “To Make Money”.

Those people usually make up most of the 98% of Failed Traders that we read about.

Then on the other hand, IMO the BEST REASON people jump into the Share Trading Sandpit, is when they decide that they want to begin in a NEW PROFESSION, they usually make up the other 2% of Newbies.

Of that 2%, 1% will break even at best because they do not have the dedication to ‘do the hard yards’.


Having said that leads me back to the discussions within the past 20 or so pages re Market Systems, Back-testing, etc.


Like everyone else I started with no knowledge of the Share Market.

Over the first 5 years I managed to educate myself, and bought into a lot of Software Trading Package’s.

During this phase of my career, I also began to question how these packages managed to produce results that would entice me to buy a certain stock – most of the providers, when questioned, could not give me a satisfactory explanation, and of course they would they not provide me with the magical formulas they were using. (PS: There is a hidden message here).

When I used MS Excel, with basic mathematical calculations, using the same data, I always differed with these programs results. So, they were obviously adding unknowns to the basic mathematical formulas.

Those package’s were obviously “Black Box Systems”, where those unexplained calculations magically produced the results what I was looking for, Big problem was that they were very seldom correct.

The other thing I noticed was that I was spending way too much time playing with each individual package, hours of trying different data entered info into the package trying to get a result that was invariably wrong, when I would rather be actively trading.


Obviously, some people like to work with complex systems, but that’s not my style.

I prefer the KISS System.

Those people that do survive in the ASX Sandpit are the ones that find “the system suits their trading style”.

To cut a long story short, I guess I’m saying that I’ve gone full circle with my trading – started with basic TA & FA, then for the next 5 years progressively working my way through the obligatory Software Packages, and for the past 30+ years I have been trading with basic TA & FA Tools – I found that too many ‘Bells & Whistles’ were a hinderance for me.


Once I fully understood basic TA, and the world of Candlesticks and Indicators (Indicators both on chart & below chart), I found that a couple of simple Indicators (set with the appropriate terms) below the Chart will act as an accurate source of info for Back-testing, and for Entry & Exit Signals.


I might also add, that Software Trading Programs 35/40 years ago were pretty basic, obviously the ones we have access to today should be totally different, but I never really tried any of them.


Guess you could class the above saga as a WOFTAM, but it’s my WOFTAM so who give a Sheit.


Skate I’ve gone full circle – Basic to Overload then back to Basic over that 35-40 year timeframe.

We first met back in 2013 when I offered you a little bit of help – Now I’m learning heaps from you, in reality you have “Set the Bar” way too high for me, so I will just learn what I can from you B4 I eventually fall off the perch.


Cheers.

DrB
 
We first met back in 2013 when I offered you a little bit of help

The kindness of others is not to be underestimated
I'm in the same camp agreeing with @DrBourse that "simplicity" works as good as anything I've found over the years. I always get a kick when experienced members decide to post information from their point of view.

Trading in a nutshell
With trading, it's as simple as "buying a position hoping sometime in the future we can offload that position to someone else at a higher price". It sounds simple but it's extremely hard to achieve & even harder to do consistently.

Explanation
I try extremely hard to explain my "views" & "systems" that I trade, where some never do. Without valuable contributions from members, this thread would have died a slow death some time ago.

Morphed
The "Dump it here" thread has morphed over time. I try very hard to post information in such a way that it encourages others to want to read on a little bit more.

Helpful posts
Since 2013 I've had computer changes resulting in losing the original information that @DrBourse kindly supplied all those years ago. Thankfully, the information has been uploaded that will last for years to come.

Skate.
There are quite a few pages that I have not posted into the 3 x DrBourse Beginners Forums,
Anyone wanting pdf copies should direct message me for my email addy - happy to give free copies to those that ask.
 
What about DEBT, that must be bad.

Not all debt is bad, some debt is even beneficial. Let me explain what good debt is and what bad debt as I explained in another thread.

1. Good debt appreciates in value.
2. Bad debt depreciates in value.

A simple example of good debt – buying a home, or making home improvements, they both add to the value of your asset, your asset appreciates in value.

A simple example of bad debt – buying a car, we all know the value of a car depreciates thus losing the value of the asset and over time it devalues to junk status.

Skate.

Back on page 4 of this forum on 16/12/18 Skate lobbed the above post.

I would like to add something to that post, something for the Newbies to ponder.


""Basically a High Debt/Equity Ratio needs to be investigated before anyone jumps to an incorrect assumption....
Debt can be a problem in some cases, But for some stocks the "Excessive Debt" is Providing Positive Returns to Shareholders....
Remember there is "Good, Productive Debt" But there is also "Bad and Unproductive Debt", as mentioned in Skates post, the trick is identifying what is OK relative to individual companies....

Say that Debt is helping provide a 2.5% Div Yield,…..Zero Debt they would also probably have a Zero Div Yield - so theoretically a bit more Productive Debt could increase that return substantially - This is where astute directors etc come to the fore - Good Financial Management will make a company greater - Bad Financial Management will send a company broke....
Have you researched the Co Directors and the Financial Team, what is their past record like???....Do they know what they are doing with the current ??% Debt/Equity Ratio???......How much is Short Term Debt, How much is Long Term Debt, What are the Loan Contract Details...are there Roll Over Provisions in the Contracts....What are the Loan % Rates, and are the Rates Competitive, or are they exorbitant????….Look at their Balance Sheet/Financial Position, Do they have money invested that could be used to repay the debts at a minutes notice????…..
What are the Tax Implications with such a High Debt Load, Good or Bad????….

In the current interest rate environment, can higher Debt to Equity ratios be sustained.

Back in the Old Days punters like us only had those mythical % guidelines to help our decision making process - in todays environment we have endless research resources at our fingertips..

The Old Rules like the ones people refer to are just that, "Old Rules".

Basically, the Debt to Equity Ratio (D/E Ratio) is explained as “to express all company liabilities as a % of Shareholders Equity”…..
I should also mention that there are NUMEROUS different ways to calculate the D/E Ratio…
Here are a few of the options:- ….
1. Total Liabilities/Shareholder Equity multiplied by 100 = Ratio %....
2. Interest Bearing Debt/ Shareholder Equity multiplied by 100 = Ratio %....
3. Interest Bearing Debt minus Cash/ Shareholder Equity multiplied by 100 = Ratio %....
4. Shareholder Equity/Long Term Debt multiplied by 100 = Ratio %....
5. Long Term Debt plus Total Equity = Capitalisation THEN That capitalisation Total is used in the final calculation of:- Capitalisation/Long Term Debt multiplied by 100 = Ratio %....
6. Total Liabilities/Net Worth minus Intangible Assets…
7. Financial Debt/ Shareholder Funds minus Intangibles & Preference Capital…

Some Analysts show their D/E Ratio as “Gearing or Leverage Ratios”…
And there are several more ways to calculate a D/E Ratio…

Misinterpreting the D/E Ratio can be fatal to your profits – you may be missing out on a great trade because you used a D/E Ratio that was ridiculously high, when, with the correct calculation is was actually very low…
The bottom line as usual is DYOR…
Find out how your provider calculates their D/E Ratio, and then decide if that calculation is what you need to help in your analysis procedures….""

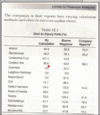
The following snapshot shows just one example of what differences that can be produced – the result for each company’s D/E Ratio can differ by 100’s….
1637134232541.gif

Cheers....
DrB.
 
Last edited:
I rely heavily on a 3 indicators combination, a CCI (10) and an MFI (30) below the chart, and a 30 day Linear Regression on the chart.
I've found over the years that the CCI is not always available on some platforms (Commsuc for example).
In the absence of the CCI, I find that a Will%R (12 or 13) gives a very similar indicator End Point as the CCI (10)

If I may ask you a question
@DrBourse would you please clarify how you use the 3 indicators in combination?

Hyperlink to the original post

I've used (AVZ) as the example
The chart example below is my interpretation of how to take advantage of the three indicators that have been suggested. Why use (AVZ)? simply because there has recently been activity by @Sean K & @Boggo in the "avz-avz-minerals thread" that I found interesting.

Hyperlink to the AVZ thread

AVZ Chart
On the chart below I've plotted the CCI (10) and an MFI (30) with the plot of the middle range of a 30 day Linear Regression. I must say using the three indicators as a simple "entry & exit reference" has merit. The three indicators listed (IMHO) deserve further research. I'll leave it up to @DrBourse will expand & clarify how best to use those indicators. The way I'm using the combination of these three indicators could simply be chalk & cheese to the original design.

AVZ.png

Skate.
 
Well if I only read @DrBourse 1st manual
The CCI(10) & MFI Indicator has 38 examples each explaining in detail how to use them both (all in his 1st manual). There are also graphics for those that find it difficult to grasp. Linear Regression is mentioned 9 times with pictorial examples & a comprehensive overview. I'm sure the information that I have received would be copyrighted so I won't use "words or descriptions" from his first manual.

I have made 37 separate posts on the (CCI) indicator
The (CCI) momentum oscillator identifies cyclical trends as it determines the difference between the mean price of a security & the average of the means over a chosen lookback period. Simply the CCI indicator compares this difference.

More information is found here

The Money Flow Index indicator (MFI)
The Money Flow Index (MFI) is a technical oscillator that uses price & volume data for identifying overbought or oversold signals in an asset that is well explained in @DrBourse 1st manual. It can also be used to spot divergences that warn of a trend change in price. The oscillator moves between 0 & 100. Unlike conventional oscillators such as the Relative Strength Index (RSI), the Money Flow Index incorporates both price and volume data, as opposed to just price. For this reason, some analysts call MFI the volume-weighted RSI. Basically, when the MFI rises, this indicates an increase in buying pressure. When it falls, this indicates an increase in selling pressure.

Linear Regression
It's simple for Amibroker to calculate the linear regression using the 30-period range as suggested. In my calculations, I have used the middle range of the "Linear Regression" line. I should also say, the function accepts periods parameter that can be constant as well as time-variant.

My next project
I'll code a strategy using @DrBourse three indicators & backtest them to see if it's viable to use these as the buy & exit condition.

Skate.
 
The Dr Bourse Daily Strategy
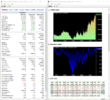
On face value the strategy performed "Okay" I suppose but the drawdown was unacceptable in its raw form. Adding a few filters & the results improve considerably.

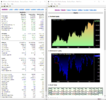
1 Year Backtest report
The backtest period is from the 18th of November being a random selection. (18th November 2020 to today)

Dr Bource 365 Backtest.png


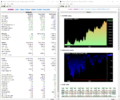
2 Year Backtest report
The backtest period is from the 18th of November being a random selection. (18th November 2019 to today)

Dr Bource 2 year Backtest.png


5 Year backtest report
The backtest period is from the 18th of November being a random selection. (18th November 2016 to today)
# Yikes, the exit strategy definitely needs a rethink.

Dr Bource 5 year Backtest.png


Summary
Yep, I'm a believer that you could use these three indicators as an entry into a trend "but using the reverse conditions" as an exit strategy, I'm not too sure about that one.

Skate.
 
I rely heavily on a 3 indicators combination, a CCI (10) and an MFI (30) below the chart, and a 30 day Linear Regression on the chart.
I've found over the years that the CCI is not always available on some platforms (Commsuc for example).
In the absence of the CCI, I find that a Will%R (12 or 13) gives a very similar indicator End Point as the CCI (10)

Dr Bourse Daily Strategy
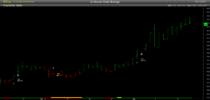
I've used (AVZ) as the example to display the "entry & exit" using @DrBourse 3 indicators that he mentions in the first post on this subject matter.

Disclaimer
Adding a few filters improved the strategy considerably but unfortunately delayed the entry at times.

Dr Bourse AVZ.png


For direct comparison
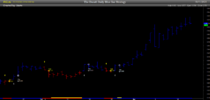
This is the strategy that has been coded from one of @ducati916 posts. Both the "Ducati Daily Strategy" & "Ducati Weekly Strategy" have an uncanny ability to pick the pivots at the start & completion of a trend.

Duc's .png

Skate.
 
Last edited:
If I may ask you a question
@DrBourse would you please clarify how you use the 3 indicators in combination?

Hyperlink to the original post

I've used (AVZ) as the example
The chart example below is my interpretation of how to take advantage of the three indicators that have been suggested. Why use (AVZ)? simply because there has recently been activity by @Sean K & @Boggo in the "avz-avz-minerals thread" that I found interesting.

Hyperlink to the AVZ thread

AVZ Chart
On the chart below I've plotted the CCI (10) and an MFI (30) with the plot of the middle range of a 30 day Linear Regression. I must say using the three indicators as a simple "entry & exit reference" has merit. The three indicators listed (IMHO) deserve further research. I'll leave it up to @DrBourse will expand & clarify how best to use those indicators. The way I'm using the combination of these three indicators could simply be chalk & cheese to the original design.

View attachment 133056

Skate.


Firstly I would have to say, and I think it's in some of my previous posts, that Penny Dreadful Stocks are NOT conducive to rational TA.
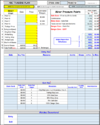
Personally I would be using an ABC Calculator on AVZ (if anyone wants a working copy, just hafta ask), here is a snapshot of that ABC Calc

If I may ask you a question
@DrBourse would you please clarify how you use the 3 indicators in combination?

Hyperlink to the original post

I've used (AVZ) as the example
The chart example below is my interpretation of how to take advantage of the three indicators that have been suggested. Why use (AVZ)? simply because there has recently been activity by @Sean K & @Boggo in the "avz-avz-minerals thread" that I found interesting.

Hyperlink to the AVZ thread

AVZ Chart
On the chart below I've plotted the CCI (10) and an MFI (30) with the plot of the middle range of a 30 day Linear Regression. I must say using the three indicators as a simple "entry & exit reference" has merit. The three indicators listed (IMHO) deserve further research. I'll leave it up to @DrBourse will expand & clarify how best to use those indicators. The way I'm using the combination of these three indicators could simply be chalk & cheese to the original design.

View attachment 133056

Skate.
Firstly I would have to say, and I think it's in some of my previous posts, that Penny Dreadful Stocks are NOT condusive to rational TA.
Personally I would be using an ABC Calculator on AVZ (if anyone wants a working copy, just hafta ask), here is a snapshot of that ABC Calc.
1637212713563.png
There is an Explanation Tab as part of the Excel SS - and there are numerous Comment Boxes (red triangles) that explain what is required.
1637212748059.png
Anyhow, back to Skate's original Question.
So here goes…
I prefer to use Trading View with a "Chart Template" as shown below.
The CCI is always set @ 10 on Close - The MFI is always set @ 30.
The Linear Regression in this example is set @ 120 (it’s a Covid thing IMO).
Note on the Right Hand Side I have about 120 codes.
As I scroll down that list the Chart for the next code automatically appears.
Then I just 'eyeball the chart' and make my decisions - takes about 20 minutes (Max) to go though the 120 codes
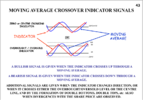
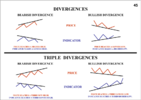
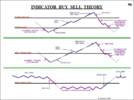
The following are examples of what I am looking for, - it will probably take a beginner a couple of years to fully understand my methodology.

First we look at what you need to look for with Chart Indicators.
1637212961907.png
1637212982411.png
1637213004713.png
1637213020995.png
1637213037733.png
1637213054477.png


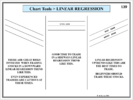
Now we need to understand the "linear Regression Indicator".
1637213121414.png
1637213143118.png
1637213166428.png
1637213182132.png


Now the Final piece of the Puzzle is the Candlesticks.
It will be easier for interested parties to go to the "DrBourse TA Help For Beginners" Forum in the Beginners Section.
There are dozens of examples of what I look for, so there is not much point in publishing them all again here.

OK - that was all pretty easy to follow, right.

Now we look at the chart and apply all the above info to the chosen chart.
Now read the Text Boxes on the Chart for my explanation of how I locate POSSIBLE TRADES.
This is just the 1st stock code on my list.

Looks like I have to continue this saga on the next post.
 
Firstly I would have to say, and I think it's in some of my previous posts, that Penny Dreadful Stocks are NOT conducive to rational TA.
Personally I would be using an ABC Calculator on AVZ (if anyone wants a working copy, just hafta ask), here is a snapshot of that ABC Calc


Firstly I would have to say, and I think it's in some of my previous posts, that Penny Dreadful Stocks are NOT conducive to rational TA.
Personally I would be using an ABC Calculator on AVZ (if anyone wants a working copy, just hafta ask), here is a snapshot of that ABC Calc.
View attachment 133077
There is an Explanation Tab as part of the Excel SS - and there are numerous Comment Boxes (red triangles) that explain what is required.
View attachment 133078
Anyhow, back to Skate's original Question.
So here goes…
I prefer to use Trading View with a "Chart Template" as shown below.
The CCI is always set @ 10 on Close - The MFI is always set @ 30.
The Linear Regression in this example is set @ 120 (it’s a Covid thing IMO).
Note on the Right Hand Side I have about 120 codes.
As I scroll down that list the Chart for the next code automatically appears.
Then I just 'eyeball the chart' and make my decisions - takes about 20 minutes (Max) to go though the 120 codes
The following are examples of what I am looking for, - it will probably take a beginner a couple of years to fully understand my methodology.

First we look at what you need to look for with Chart Indicators.
View attachment 133080
View attachment 133081
View attachment 133082
View attachment 133083
View attachment 133084
View attachment 133085


Now we need to understand the "linear Regression Indicator".
View attachment 133086
View attachment 133087
View attachment 133088
View attachment 133089


Now the Final piece of the Puzzle is the Candlesticks.
It will be easier for interested parties to go to the "DrBourse TA Help For Beginners" Forum in the Beginners Section.
There are dozens of examples of what I look for, so there is not much point in publishing them all again here.

OK - that was all pretty easy to follow, right.

Now we look at the chart and apply all the above info to the chosen chart.
Now read the Text Boxes on the Chart for my explanation of how I locate POSSIBLE TRADES.
This is just the 1st stock code on my list.

Looks like I have to continue this saga on the next post.
The saga continues.

1637213550316.png
Look at what happens to the Price when the MFI is At or Above its Centreline, AND also what happens when it is Below it's Centreline.
There are dozens of other examples within the "DrBourse TA Help For Beginners" Forum in the Beginners Section.
The above principles apply to any term chart, Tick, Minute, Daily, Weekly, Mthly, Yearly - it just depends on you Trading or Investment timeframe.

Skate, to summ up, yes I use 3 Indicators, but there are other TA considerations, like Candlesticks, Gaps, Major & Minor Sup & Res Lines, etc, etc

This Profession is not easy, most idiots dissapear pretty quickly, only those with the dedication to go the hard yards will survive.

Note: AVZ is one of the few PD's I've seen that works under my process.

Cheers.
DrB
 
Note: AVZ is one of the few PD's I've seen that works under my process.

AVZ was selected at random
The selection of (AVZ) was instigated by recent posts.

The Linear Regression in this example is set @ 120 (it’s a Covid thing IMO).

Fair enough
Resetting the parameter to (120) delayed the exit slightly without a noticeable difference to the entry. But in saying this, the next quote of yours needs to be considered to understand the delay exit signal.

but there are other TA considerations, like Candlesticks, Gaps, Major & Minor Sup & Res Lines, etc, etc

The most recent signal
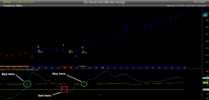
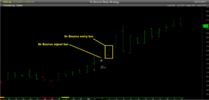
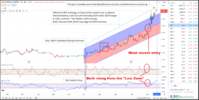
I have marked each of our charts to display my interpretation of where the most current buy signal should be. I'm using the "Low Band" rather than the "Low line" of the band. I'm sure it will make a difference. In my defense, the Amibroker code is doing all the heavy lifting without intervention.

# Question 1
Using my chart - is the most recent entry for (AVZ) as "indicated" on the chart accurate?

(a) Yes
(b) No
(c) Close

Dr Bourse AVZ.png


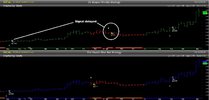
# Question 2
Using your chart - is the most recent entry as indicated by the "red circles" on the chart accurate? Also just a minor point I have indicated by the red square a false breakout. There is another midway between the square & circle that I didn't markup. I'm positive these false breakouts could be eliminated.

(a) Yes
(b) No
(c) Close

Dr Bourse AVZ CHART.png

In conclusion
I'm absolutely positive that beginners reading these posts would find it difficult to comprehend let alone understand. Without having @DrBourse manuals to reference, as I'm sure it would be all "Double-Dutch". With all that said, it's a prime example of how we can lever off another person's ideas as well as their methodologies.

Skate.

Not just beginners imo.

Back in the formative Metastock days I went through a lot of processes somewhat similiar to some of what i've seen in above posts.
I have gone full circle and now work on a weekly KISS principle, works for me but maybe not for everyone !

(click to expand)
AVZ W 171121.png
 
The above principles apply to any term chart, Tick, Minute, Daily, Weekly, Mthly, Yearly - it just depends on you Trading or Investment timeframe.

Well blow me down
The signals are just efficient no matter the periodicity. The signals are a little late compared to the "Ducati Blue Bar Weekly Strategy"

Blow me down.jpg

Skate.
 
I have gone full circle and now work on a weekly KISS principle, works for me but maybe not for everyone !

Hey, @Boggo I'm positive using the (KISS) principle would work for everyone even those who take pleasure trading complex strategies. It appears you & @DrBourse have come full circle.

BTW
Once again, thank you for posting up a chart of (AVZ), in doing so gives everyone the opportunity to understand clear & concise entry points. I take a lot of pride in the structure of my charts so they can be easily understood with a passing glance but I think you win in this department.

May be of interest.
(Disclosure,I do hold AVZ).

The HappyCat Chart
For full disclosure, I hold (AVZ) as well. I'm uploading "The HappyCat Strategy" chart for comparison. We all take position at the mercy of the parameters & filters we elect to use.

Pride HC.jpg


Crikey! Why did I have this on my watch list and watch this happen from the side lines... :mad:

Well, two out of three isn't bad
But it's a real shame that @Sean K is not enjoying the ride. As they say "the more the better".

Skate.
 
Well blow me down
The signals are just efficient no matter the periodicity. The signals are a little late compared to the "Ducati Blue Bar Weekly Strategy"

View attachment 133097

Skate.
Hi Skate,
Well if I only read @DrBourse 1st manual
The CCI(10) & MFI Indicator has 38 examples each explaining in detail how to use them both (all in his 1st manual). There are also graphics for those that find it difficult to grasp. Linear Regression is mentioned 9 times with pictorial examples & a comprehensive overview. I'm sure the information that I have received would be copyrighted so I won't use "words or descriptions" from his first manual.

I have made 37 separate posts on the (CCI) indicator
The (CCI) momentum oscillator identifies cyclical trends as it determines the difference between the mean price of a security & the average of the means over a chosen lookback period. Simply the CCI indicator compares this difference.

More information is found here

The Money Flow Index indicator (MFI)
The Money Flow Index (MFI) is a technical oscillator that uses price & volume data for identifying overbought or oversold signals in an asset that is well explained in @DrBourse 1st manual. It can also be used to spot divergences that warn of a trend change in price. The oscillator moves between 0 & 100. Unlike conventional oscillators such as the Relative Strength Index (RSI), the Money Flow Index incorporates both price and volume data, as opposed to just price. For this reason, some analysts call MFI the volume-weighted RSI. Basically, when the MFI rises, this indicates an increase in buying pressure. When it falls, this indicates an increase in selling pressure.

Linear Regression
It's simple for Amibroker to calculate the linear regression using the 30-period range as suggested. In my calculations, I have used the middle range of the "Linear Regression" line. I should also say, the function accepts periods parameter that can be constant as well as time-variant.

My next project
I'll code a strategy using @DrBourse three indicators & backtest them to see if it's viable to use these as the buy & exit condition.

Skate.
Hi Skate, in your above post you mention "The Money Flow Index (MFI) is a technical oscillator that uses price & volume data for identifying overbought or oversold signals in an asset that is well explained in @DrBourse 1st manual. It can also be used to spot divergences that warn of a trend change in price. The oscillator moves between 0 & 100".

I feel I should reitterate that I use a Centreline on the MFI, not the normally accepted O'Bought & O'Sold Lines of 60 & 40.
I reckon that would interfere with your 'backtesting' of my approach to trading.
Cheers M8
 
Top