Australian (ASX) Stock Market Forum

Dump it Here

Hi Skate,

Hi Skate, in your above post you mention "The Money Flow Index (MFI) is a technical oscillator that uses price & volume data for identifying overbought or oversold signals in an asset that is well explained in @DrBourse 1st manual. It can also be used to spot divergences that warn of a trend change in price. The oscillator moves between 0 & 100".

I feel I should reitterate that I use a Centreline on the MFI, not the normally accepted O'Bought & O'Sold Lines of 60 & 40.
I reckon that would interfere with your 'backtesting' of my approach to trading.
Cheers M8

Thanks for the heads up
I’ve also acknowledged how hard it is to “Code” the skills that others possess, let alone trying to interpret what you have just read. When there are so many variables with fundamentals thrown in “not to mention” mental & visual skills - it’s impossible to have signals aligned.

Thanks for the additional information. This small exercise was extremely rewarding because I have a better idea of how to marry those indicators to achieve a positive outcome.

Skate.
 
AVZ was selected at random
The selection of (AVZ) was instigated by recent posts.


Fair enough
Resetting the parameter to (120) delayed the exit slightly without a noticeable difference to the entry. But in saying this, the next quote of yours needs to be considered to understand the delay exit signal.


The most recent signal
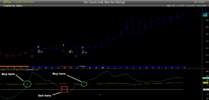
I have marked each of our charts to display my interpretation of where the most current buy signal should be. I'm using the "Low Band" rather than the "Low line" of the band. I'm sure it will make a difference. In my defense, the Amibroker code is doing all the heavy lifting without intervention.

# Question 1
Using my chart - is the most recent entry for (AVZ) as "indicated" on the chart accurate?

(a) Yes
(b) No
(c) Close

View attachment 133092


# Question 2
Using your chart - is the most recent entry as indicated by the "red circles" on the chart accurate? Also just a minor point I have indicated by the red square a false breakout. There is another midway between the square & circle that I didn't markup. I'm positive these false breakouts could be eliminated.

(a) Yes
(b) No
(c) Close

View attachment 133093

In conclusion
I'm absolutely positive that beginners reading these posts would find it difficult to comprehend let alone understand. Without having @DrBourse manuals to reference, as I'm sure it would be all "Double-Dutch". With all that said, it's a prime example of how we can lever off another person's ideas as well as their methodologies.

Skate.
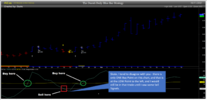
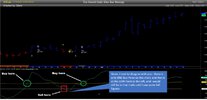
Question 2.
I would not have been interested in entering a trade in early Nov, That is a Double Top that you circled on the CCI, that is a SELL Signal.
The idea is to Buy when the Indicators are rising from below the O'Sold Line, and to Sell when the Indicators are dropping from above the O'Bought Line.
The best Buy Signal on that chart is the one I marked in the Text Box "Buy - Both Indicators Rising from Lows" at about 0.15c, and I can see no real reason to Exit that Trade YET, maybe tomorrow or in a few days time, but not yet.
DrB
 
The best Buy Signal on that chart is the one I marked in the Text Box "Buy - Both Indicators Rising from Lows" at about 0.15c, and I can see no real reason to Exit that Trade YET, maybe tomorrow or in a few days time, but not yet.

@DrBourse thank you for the clarification. It just goes to prove, I have more work to do.

Skate
 
If I may ask you a question
@DrBourse would you please clarify how you use the 3 indicators in combination?

Hyperlink to the original post

I've used (AVZ) as the example
The chart example below is my interpretation of how to take advantage of the three indicators that have been suggested. Why use (AVZ)? simply because there has recently been activity by @Sean K & @Boggo in the "avz-avz-minerals thread" that I found interesting.

Hyperlink to the AVZ thread

AVZ Chart
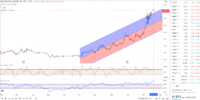
On the chart below I've plotted the CCI (10) and an MFI (30) with the plot of the middle range of a 30 day Linear Regression. I must say using the three indicators as a simple "entry & exit reference" has merit. The three indicators listed (IMHO) deserve further research. I'll leave it up to @DrBourse will expand & clarify how best to use those indicators. The way I'm using the combination of these three indicators could simply be chalk & cheese to the original design.

View attachment 133056

Skate.
Hi Skate,

I think in my post from some time ago (can’t find the exact post) I said that “I rely heavily on a 3 indicators combination, a CCI (10) and an MFI (30) below the chart, and a 30 day Linear Regression on the chart”.

That’s is correct, BUT looking at that ‘chart template’ with the 3 basic indicators is just the 2nd step in my process.


Again, as I have mentioned previously in the three DrBourse Help for Beginners Forums, I look to Buy on Monday, Tuesday or Wednesday, then Sell on Tuesday, Wednesday, Thursday or Friday. My Exit Points are primarily dictated by what I read within Candlesticks, Indicators and Other Tools of Trade. I will only buy if/when my entry parameters are met. Some of those parameters will change hour by hour, according to market movements.

I Prefer to Trade Financially Sound Stocks, that immediately reduces any Risk, Pullbacks will still happen, but if the FA is sound then the stock should recover. My Stock Selection is based on 60% Financial Analysis and 40% Technical Analysis - If a stock does not meet my FA criteria, then I do not bother with its TA (so PD’s are never on my Hit List) - Once I locate a Financially Sound Stock, I then proceed to look at its TA.

NOTE:- I conduct my own FA, I regularly update my list of 120 stocks, I only use a company’s EOFY Balance Sheet & their regular updates, I do not believe any other published analysis because each one manages to embellish the results to suit their needs (There is a separate post in the DrB FA Forum that explains what I mean).


My TA starts by referring to page 118, looking at my Indicator positions on a Wkly Chart, then a Dly Chart to locate +ive Stocks.

Then, the 3 main things I look for are...

1. Candles that meet my Linear Regression Indicator requirements.... (pages 139 to 142)

2. MFI above a Centreine of 50... (page 95)

3. CCI Rising from an Oversold Position... (pages 108 & 109)

Then I would look at other TA, like the rest of my On Chart Indicators, Candle Formations, Trend/Support/Res Lines, Mkt Depth, Announcements, Overnight ADR's & OTC's, etc etc..


So Basically – If FA is OK, I proceed, if 1, 2 & 3 (above) meet my needs, then I proceed. ---- HOWEVER, if any of those levels are not met, then I scrap that stock for that day.


IMO, it would be impossible to ‘automate, or program’ my trading process – software programmers are not that intelligent.


Direct Message me if anyone would like a .pdf copy of the pages I often refer to, I will email them to you.

Cheers.
DrB
As a quick followup to one of my previous posts, here is this mornings AVZ Chart - we now have our 1st Confirmed Exit Signals.1637278228503.png
 
As a quick followup to one of my previous posts, here is this mornings AVZ Chart - we now have our 1st Exit Signals.View attachment 133111
Also Note the Overseas ADR & OTC Codes to the Right Hand Side of the AVZ Chart - checking these each morning gives me an idea of what MAY happen to our Aust counterpart codes.
As I mentioned previously there is an in-depth post on ADR's in the DrB GENERAL Forum.
 
Last edited:
I think in my post from some time ago (can’t find the exact post) I said that “I rely heavily on a 3 indicators combination, a CCI (10) and an MFI (30) below the chart, and a 30 day Linear Regression on the chart”. That’s is correct, BUT looking at that ‘chart template’ with the 3 basic indicators is just the 2nd step in my process. IMO, it would be impossible to ‘automate, or program’ my trading process.

I have to agree with you there
It's a real shame experience takes time. Also, I agree that having the correct skillset & using a range of indicators allows you to be more reactive & in tune with the unfolding situations.

We all see something different
I'm saying, give the same price chart to a variety of experienced traders & they will always see something different. When it comes to chart reading, I'll leave that to the expert as some patterns can give you a false sense of security leading you into making a poor trading decision.

Skate.
 
The consistency of indicators
For those who lack the required skills to decipher a range of fundamentals (that can be a real challenge at times), there is another option. Systematic trading is an alternative, where you can build or buy a robust trading strategy. Using indicators has one advantage, which is consistency "over a range of repeatable patterns". Selecting the correct indicators just might be the key to success. Poor selection can often result in poor trading performance & drawdowns. So, how can we build more robust trading strategies?

The answer is simple
By levering off the knowledge of others. I stress test every idea that gels. @ducati916, @peter2, & @DrBourse have promoted such ideas that I have capitalised on. These ideas are not only promoted in the "Dump it here" thread but also scattered throughout the forum.

Skate.
 
I rely heavily on a 3 indicators combination, a CCI (10) and an MFI (30) below the chart, and a 30 day Linear Regression on the chart.

This got me thinking
It was a "brainfart" really how to combine 3 indicators as a trading strategy. My initial idea was to "Buy" when the CCI(10) was greater than both the MFI(30) & the 30-day Linear Regression & "Sell" when the close of the CCI(10) is lower than both MFI(30) & the 30-day Linear Regression.

Just to be clear
Using the 3 indicators "my way" was not the way intended or suggested. Throwing caution to the wind, I set about coding these indicators to form an entry & entry point, the criteria using the indicators in this manner was simple & straightforward. The results exceeded my expectations & now the idea has been added to my "to-do" list.

Recap
If you look at the buy & sell points in the chart below the signals (green circles & red square) are respectable & worthy of further research "in any man's language".

AVZ.png

Skate.
 
Most traders can’t predict
I tend not to believe those who think they can predict the future but can’t predict if the market will open higher or lower tomorrow. Trading is all about catching price movements & the most sought-after indicators are those that identify price trends. While the trends are obvious in retrospect, it's another matter altogether to identify the trend in the heat of trading. Combining the three indicators @DrBourse has highlighted will not only help traders detect the trend direction but also the trend strength of the movement.

Deceived by patterns
As a mechanical system trader, I'm constantly looking for repeatable chart patterns, patterns that can be turned into a trading strategy. It's one thing to have a good idea but without vigorous testing, it will all be for nought. Patterns are everywhere. Some patterns are deadly & can lead you to make a poor decision looking at the "middle of the chart" trying to predict what will happen next on the "right-hand edge of the chart".

Skate.
 
This got me thinking
It was a "brainfart" really how to combine 3 indicators as a trading strategy. My initial idea was to "Buy" when the CCI(10) was greater than both the MFI(30) & the 30-day Linear Regression & "Sell" when the close of the CCI(10) is lower than both MFI(30) & the 30-day Linear Regression.

Just to be clear
Using the 3 indicators "my way" was not the way intended or suggested. Throwing caution to the wind, I set about coding these indicators to form an entry & entry point, the criteria using the indicators in this manner was simple & straightforward. The results exceeded my expectations & now the idea has been added to my "to-do" list.

Recap
If you look at the buy & sell points in the chart below the signals (green circles & red square) are respectable & worthy of further research "in any man's language".

View attachment 133121

Skate.
1637288329326.png
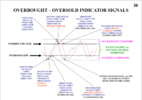
Perhaps refer to pages 38 to 43 for an explanation of how my world works.
Cheers M8
 
View attachment 133123
Perhaps refer to pages 38 to 43 for an explanation of how my world works.
Cheers M8

See the following page 38 - Note the 1st, 2nd, 3rd & 4th Buy Points - IF was in this trade (buying at the 1st Buy Point), and if the profit was sufficient, I could have Sold to you at the time you suggest to buy which looks like it was after the 4th Buy Point..
1637289018511.png
Cheers M8
 
Perhaps refer to pages 38 to 43 for an explanation of how my world works.

Fair enough
I was throwing it out there (chewing the fat) how I could use the 3 indicators other than the way you have suggested. Admittedly my posts were well off the mark, but it was another way "my way" how I could use these 3 indicators within a strategy. I made a disclaimer that the way "I coded" those 3 indicators created a "few false signals" where your method eliminates them somewhat. I'll recode the entry condition as per your suggestion. But before I do, I want to make a few remarks about how to reduce false signals.

Let's talk about false signals
False signals are impossible to avoid & this is where the commodity channel index (CCI) comes into its own by filtering out many of those false, annoying signals. There are a number of rather complicated indicators available to measure trend direction & strength but none of these indicators, unfortunately, are perfect.

Some indicators do a fantastic job
The average directional index (ADX) & the moving average convergence/divergence (MACD) indicators are just two that never fail to perform. The (ADX) shows the strength of a price movement & the (MACD) shows the direction of the move. You can even use the (ADX) functions as a trend detector, rising as price strengthens into an identifiable trend & falling when price moves sideways or loses its trending power.

Unfortunately
The (ADX) does not reveal the trend direction. The (MACD) on the other hand, indicates price momentum identifying price direction. Combine the (ADX) & (MACD) with a (CCI) & (MFI) might produce pleasing results. Use them incorrectly & it will end in tears.

Skate.
 
Last edited:
Perhaps refer to pages 38 to 43 for an explanation of how my world works.
Cheers M8

Makes more sense.jpg

Yes, that makes more sense
The entry signal indicated by the (red box) as rightly explained by your blue caption on the chart aligns with @ducati916 Blue Bar entry. It's a pity that there is a required amount of intervention in deciding to take a position or pass over it.

I'm not in that camp
I only allocate 10 minutes to physical trading each week & most of that time is taken up with entering (buy & sell) positions in the pre-auction.

Skate.
 
Last edited:
So @Skate

This chap has an interesting take: https://www.olivermsa.com/msa-methodology.html

Now I have no idea if this could be coded. For obvious reasons he does not go into detail on how he does it. I have created a copy cat using his basic thesis, which if you are interested I can PM you on.

jog on
duc

Momentum Structural Analysis (MSA)
After having viewed the website & watch the presentation video I have to conclude that their "Momentum Strategy" is a combination of "Fundamental as well as Technical" analysis to generate two reports per month covering short-term & long-term trends for you to take advantage of. Wait for it, for a low cost of $299 per year.

Short background (for those interested)
J. Michael Oliver entered the Futures side of trading in 1975. In the 1980s Mike began to develop his own momentum-based method of technical analysis. He learned early on that orthodox price chart technical analysis left many unanswered questions and too often deceived those who trusted in price chart breakouts, support/resistance, and so forth. In 1987 he decided to develop his structural momentum tools into a full analytic methodology. Read the testimonials & it's evident he is worth his weight in salt, gold, whatever.

Skate.
 
I want to discuss the "Ducati Blue Bar Strategy"
The MSA that Duc hyperlinked to is built around momentum & other propriety fundamental feeds. Now back to @ducati916 who often drops gems & often speaks about taking advantage of momentum. I'm of the opinion those gems never get the attention they deserve.

Not a second thought
I don't think many give Duc's gems a second thought let alone apply a blow torch to his ideas. We all have opinions of what works & what doesn't when it comes to trading but at times find it difficult to have the confidence in putting our money on the line trading someone else's idea.

MSA
After reading @ducati916 recent post & on a propriety MSA strategy I believe it's very similar to "Ducati Blue Bar Strategy" which is a momentum strategy in its purest form. "The "Ducati Blue Bar Strategy" has an uncanny ability to pick moment pivots in "real-time" with extreme accuracy & I have demonstrated this in real-time in this thread.

Skate.
 
"The Ducati blue bar strategy" & the "Duc Indicator" are both brilliant ideas
Since Duc has dropped those gems I've been hard at work trying to develop them further. We have all been given the same information but I'll bet you pounds-to-peanuts not one reader is running with the idea.

When others post
It's exciting to experience how other traders such as @DrBourse, @peter2, @MovingAverage, @qldfrog, @frugal.rock & a few others "how" they make their stock selection & the methodology that decides when a position is to be entered. Admittedly I don't have the time or unique skills-set to evaluate positions as they do. My "go-to" to do the evaluation is either the weekly or daily "Ducati Blue Bar Strategy" to understand their reasoning a little better.

Trading the bounce
The "Ducati Blue Bar Strategy" trades the "bounce" by picking when a trend turns using momentum, "volatility & volume". If the trend is up (Blue Bars) we buy & if the trend is down (Red Bars) we sell. The strategy is simple, effective & clean, using a combination of "Parameters, Filters & PositionScore" the profitability of the strategy jumps off the charts.

More can be found here

Skate.
 
Top