- Joined
- 17 October 2012
- Posts
- 707
- Reactions
- 1,389
Really enjoying the discourse on backtesting periods here recently. Frankly I feel both approaches are wise and have their benefits. Longer backtests tend to be best for finding robust parameters and ruthlessly simplifying complexity - i.e. minimise the number of parameters that might be cuve-fit at all costs - or the "degrees of freedom". You do your best to avoid steep spikes in backtest optimiziation graphs.
But don't be afraid to monitor short and medium term performance against backtests as market regimes will change. There is no perfect system, so likewise it may be that long term (super/retirement fund) strategies should be more robust over longer periods, but there could also be value running additional systems where the style is more aggressive entry/exit over shorter time frame with benefit re-optimizing parameters very 6-12 months.
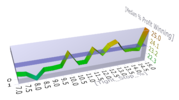
A large part of the problem too is how you optimize. For breakout or pullback trend following systems, there is invariably a very unbalanced effect from a small number of trades with huge outperformance compared to the bulk of trades with small to medium profits, or (hopefully) contained losses. Here are 2 plots of %profit versus weeks in the market for 2 very different weekly trend following systems. The first is much more aggressive, the second stubbonly holds on for profit where it can.
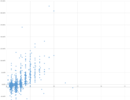
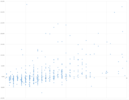
Optimizing these 2 systems is a completely different ball game. The first will live and die by commissions and slippage but offers hope of a smoother upward equity curve if set up correctly. The second is at HUGE risk of over-optimistic curve-fitting. You could change filter conditions, buy and sell logic just a little and have a huge effect on overall profit and returns.
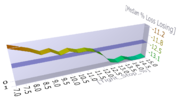
I'm usually trading the second style of system, and becoming more interested in the compromise and trade off for performance versus risk. As such, have recently started to monitor MEDIAN % profit and loss during backtest work as the average values in Amibroker must be biased for system 2 - just one more trade appearing in that top right corner will skew average stats massively.
Only early days with this idea, but so far median % profit seems to nicely reflect parameter changes that increase profit, whilst median % loss tends to show a conflicting reversed optimal value for the same parameter to contain DD and open risk. The optimial point for each trader will vary depending on whether you wish to maximise returns, minimise risk, or balance the 2 at your comfort point somewhere in the middle.
But don't be afraid to monitor short and medium term performance against backtests as market regimes will change. There is no perfect system, so likewise it may be that long term (super/retirement fund) strategies should be more robust over longer periods, but there could also be value running additional systems where the style is more aggressive entry/exit over shorter time frame with benefit re-optimizing parameters very 6-12 months.
A large part of the problem too is how you optimize. For breakout or pullback trend following systems, there is invariably a very unbalanced effect from a small number of trades with huge outperformance compared to the bulk of trades with small to medium profits, or (hopefully) contained losses. Here are 2 plots of %profit versus weeks in the market for 2 very different weekly trend following systems. The first is much more aggressive, the second stubbonly holds on for profit where it can.


Optimizing these 2 systems is a completely different ball game. The first will live and die by commissions and slippage but offers hope of a smoother upward equity curve if set up correctly. The second is at HUGE risk of over-optimistic curve-fitting. You could change filter conditions, buy and sell logic just a little and have a huge effect on overall profit and returns.
I'm usually trading the second style of system, and becoming more interested in the compromise and trade off for performance versus risk. As such, have recently started to monitor MEDIAN % profit and loss during backtest work as the average values in Amibroker must be biased for system 2 - just one more trade appearing in that top right corner will skew average stats massively.
Only early days with this idea, but so far median % profit seems to nicely reflect parameter changes that increase profit, whilst median % loss tends to show a conflicting reversed optimal value for the same parameter to contain DD and open risk. The optimial point for each trader will vary depending on whether you wish to maximise returns, minimise risk, or balance the 2 at your comfort point somewhere in the middle.
Last edited:

