Australian (ASX) Stock Market Forum

DrBourse TA Help for Beginners

Unwanted or Annoying Posts can be Removed OR Hidden, making reading and understanding a "Chain of Posts" much easier.
As shown below, Use the "Search" facility, Top Right of the ASF Screens, and search for 'ignore', then read the first 2 posts for the explanation.

1641498708891.png

This process can easily be reversed later, if you need to.
 
Today is Friday 7/1/22 6.16am.
Just before close 6/1/22 the MFI gave it's Exit Signal.
Lesson Completed.

1641500071774.png
 
Today is Friday 7/1/22 6.16am.
Just before close 6/1/22 the MFI gave it's Exit Signal.
Lesson Completed.

View attachment 135338
Playing the 'Devils Advocate', with a daily chart (unless you have live data) you wouldn't get that signal until the market closed - and in any event as it closed on its lows, you would be out at the bottom yesterday. While gold lost 2% in the US overnight the XAO futures here are green and NCM's indicative open is up 1.2%. All I'm saying is that yesterday could have been oversold and prices will pick up today - so I'm not sure I don't see jumping out of NCM at close yesterday as premature. Anyway, just an observation - and today should be interesting as Fridays are often unrewarding.
 
Unwanted or Annoying Posts can be Removed OR Hidden, making reading and understanding a "Chain of Posts" much easier.
As shown below, Use the "Search" facility, Top Right of the ASF Screens, and search for 'ignore', then read the first 2 posts for the explanation.

View attachment 135336

This process can easily be reversed later, if you need to.
So you have no intention of honesty in your thread else you would have actually responded to legitimate questions posed.
The fact you had to block me suggests you are disingenuous as I called out several comments you made, and that was your response.

I never had a problem with the information you offered, nor your chart of NCM, as there are hundreds of different trading strategies that can be successfully deployed, and a number of them are on show at ASF .

But if you are going to criticise other TA without explaining where or why it was wrong then we learn nothing.
I toyed with an NCM chart using just one technical indicator and got clearer results with just a few simple trading rules. Using TSI crossings on an hourly basis gives pretty much the same result as your multiple indicators.
 
Hi GN,

As usual we are on the same page.

I agree with what you say, and yes, I have access to live data.

However, in my defence, I would like to say that the recent NCM posts were directed to Beginners, and have been about ‘explaining how I read certain indicators’, which I feel I have done.

Another Trader told me he sold just above yesterday’s 1st low, he was obviously a bit smarter than me.

Each individual must have a plan for Buying & Selling that suits their Level of Tolerance.
Thumb up for your last sentence.
What's that saying..Trade with your Head not your heart..
 
Thumb up for your last sentence.
What's that saying..Trade with your Head not your heart..
Just borrowing Skate quote...

Conviction
A person with a conviction is a hard person to change. Tell him you disagree and he turns away. Show him facts or figures and he questions your sources. Appeal to logic and he fails to see your point.
 
Hi GN,

As usual we are on the same page.

I agree with what you say, and yes, I have access to live data.

However, in my defence, I would like to say that the recent NCM posts were directed to Beginners, and have been about ‘explaining how I read certain indicators’, which I feel I have done.

Another Trader told me he sold just above yesterday’s 1st low, he was obviously a bit smarter than me.

Each individual must have a plan for Buying & Selling that suits their Level of Tolerance.
While a bit of the topic of indicators, one of the principles of trading is to not trade (or be aware of the risks if you do) in a downtrend. NCM has been in an unbroken technical weekly downtrend for 18 months and as such any trades during that time are 'swimming upstream'. Some may look at the chart and say there have been uptrends, but not so when you consider a trend needing to play out over 12 weeks and NCM's last attempt was only 11 weeks. Current moves suggest an uptrend might be on the cards if it can get above $26.25.
Is there any appreciable difference in your CCI/MFI signals during uptrends and downtrends?
Keep safe.
 
GN, The CCI/MFI produces results, or End Points, based on the term of each indicator, so for my CCI it's formula is based on the last 10 days, and for the MFI the last 30 days.
The CCI 10 reflects 'knee jerk actions' by punters over the previous 10 days trading, and the MFI30 reflects a longer term, more sober, and a longer average result, as Volume trends tend to react slower than conventional ST Indicators - so the CCI/MFI combination provides me with a Balanced Indicator End Point outcome.

Idon't usually trade a Severe Dramatic Linear Regression Downtrend - in the NCM example above, the LR Trend is only Slightly down over the past 100 days, and the ST Trend for the term of my above example, is UP.

So IMO, with my knowledge of TA, I am happy to trade NCM based on it's current 100 day, slightly down almost flat Linear Regression TA.

AND

You asked "Is there any appreciable difference in your CCI/MFI signals during uptrends and downtrends?" - No difference for me personally, happy to trade some downtrends, it just depends on how I read the TA at that time, others will obviously disagree.

Someone recently inferred that the word contrarian only referred to Financial Analysis, BUT most dictionaries suggest it means "opposing or rejecting popular opinion or current practice, and/or a person who opposes or rejects popular opinion, especially in stock exchange dealings", that pretty well sums me up, never accept the Norm and always push the Commonly Accepted Parameters - Always accepting the Norm will turn you into a Lemming, and we all know the story on what happens to them.
Cheers M8
 
Someone recently inferred that the word contrarian only referred to Financial Analysis, BUT most dictionaries suggest it means "opposing or rejecting popular opinion or current practice, and/or a person who opposes or rejects popular opinion, especially in stock exchange dealings"
You are very good at avoiding the point made.
People use TA to trade because the system/s they use have been tested to give them a statistical edge.
A contrarian approach to that means rejecting that edge and gambling on a whim. In other words you are not using TA for the trade.

As @Greynomad99 pointed out, buying into a downtrend is not a typical recipe for success and is also contrary to your three indicator approach.

If you are proposing this thread for beginners then why are you using examples which break your own rules? Surely there are better and safer examples.
 
Beginners need an Advantage.

As a Beginner you need to understand the Original Parameters of your chosen Indicators.

HOWEVER,

If, as a beginner, you continue to accept the normal, tried & true original TA settings for indicators, you will always be one of herd, and that means you are part of a Large Group of Punters all trying to do the same thing at the same time.

You will never have an Advantage over the Sheep because they are all reading the same old normal tried & true settings.

You will always be a Sheep and you will eventually turn into a Lemming.

There is “No Advantage” in being part of the Herd.

The only Advantage you can gain in TA is to develop your own Contrarian Views.

You have to develop a way of getting TA Signals from your Indicators BEFORE the Sheep realise what is going on.

You must learn to deviate from the norm, Back-test everything (as I mention in page 36), Start with Normal Accepted Settings, then experiment with those settings or combinations.

Remember that all indicators were developed with a basic set of parameters, now there are dozens of alternative approaches and interpretations from all over the world, you just need to understand the ORIGINAL parameters of you chosen Indicators, then ‘tweak’ those setting just to see what happens.
For example, most Sheep use a 50 or 200 Simple Moving Average, perhaps you could try 45 & 190 WEIGHTED Moving Average (pages 50, 80 & 81)


It’s not easy, it’s not meant 2B easy, if it was easy everybody would be doing it and then you would just end up in amongst a Bigger Herd of Sheep.


More info to follow in coming weeks for those of you that are interested, I will drop a post abt Scanners that may help you with that process of experimentation.


Obviously it does not matter what I post as there will always be ‘Uneducated point scorers crawling out of the woodwork’ – I just ignore them, as Beginners you may need to do the same.

Educated Opinions and Sensible Questions, particularly from beginners are always welcome, either here in the forums, or via Direct Conversation/Direct Messaging (simply click on my avitar then click “Start Conversation”).
1641771501960.png
1641771514919.png

I only visit here when time permits, usually once or twice a week.

Cheers.
DrB
 
Another area that Beginners should take note of is the Colour of each individual Candle.

Beginners need to find out why different providers show different coloured candles that are based on the same data.


The 2 snapshots below are of FMG 15/9/20 to 19/11/20 incl.


This Snapshot is from Trading View Charts.
It shows 28 RED Candles & 20 GREEN Candles.
1641947251118.png


This next Snapshot is from Commsec Charts.
It shows 25 RED Candles & 22 GREEN Candles, and just as importantly Commsec show no Candle for 16/11/20 (the 4th Candle from the right).
1641947269334.png


The problem only arises, IF, you are using Candlesticks as part of your TA.

You might think the Commsec Right Hand Side Candle adds weight to your TA.

However

Looking at the Trading View Right Hand Side Candle, note that it gives the exact opposite signal.

Now I realise that the Candle in question is not an Earth-Shattering Signal, but sometimes they are.


I repeat - Beginners Should Question Everything.
 
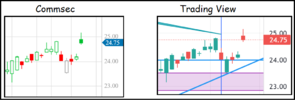
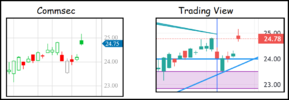
As a Follow-up to my last post, and to emphasize the differences, the Snapshots below creates a bigger dilema when reading TA.
Both Snapshot are of NCM @ COB 12/1/22.

1641965574602.png

Which chart are you going to believe - The Comsec Chart GREEN Candle looks like a Positive Signal.
The Trading View Chart RED Candle conveys a totally Negative Signal.

The 'Gap Up' created by todays Candle provides 2 Support Lines, the reading of the Commsec Chart suggests further Uptrend,
BUT
The reading of the Trading View Chart suggests that the next move is DOWN.


Beginners Beware.
 

Attachments

  • 1641964835447.png
    1641964835447.png
    38.5 KB · Views: 8
As a Follow-up to my last post, and to emphasize the differences, the Snapshots below creates a bigger dilema when reading TA.
Both Snapshot are of NCM @ COB 12/1/22.

View attachment 135624

Which chart are you going to believe - The Comsec Chart GREEN Candle looks like a Positive Signal.
The Trading View Chart RED Candle conveys a totally Negative Signal.

The 'Gap Up' created by todays Candle provides 2 Support Lines, the reading of the Commsec Chart suggests further Uptrend,
BUT
The reading of the Trading View Chart suggests that the next move is DOWN.


Beginners Beware.
Hi Dr, I follow Commsec's chart every day. Where do you get the Trading chart? Can see both charts showing 2 different prediction, it's quite confusing n scary.
 
Not all that scary M8.

I just want to make sure beginners are aware of the differences that can be produced on different Charts, from different platforms, that is, how your software provider presents Candlestick Colours.

And your choice of how your chart is presented to you are crucial (eg Calendar Days, or Week Days etc)

Once beginners understand how their Candlesticks are presented, they can adjust their personal interpretations to suit their needs.

Some Software Providers calculate a days Candle wholly on a days “Course of Trades” – Others start their calculations from the previous day’s Closing figure, or from the previous days High, that concept is what beginners need to understand.

In yesterdays (above) examples, Commsec includes the previous day’s Closing figure, and Trading View calculates the day’s Candle wholly on the days “Course of Trades”.

Personally, I would never use Commsec Charts – don’t like their Candlesticks, and there are often candles missing altogether.

===========================================================

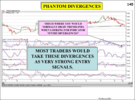
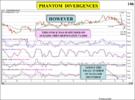
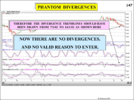
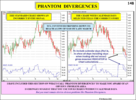
Missing Candles leads me onto a Similar, BUT Different problem, that you should be aware of, something I refer to as “Phantom Divergences”.

Missing candles produce “incorrect indicator End Point presentation”, particularly on ST settings.

Pages 145 to 148 explain the “Phantom Divergences” problem.
1642032321138.png
1642032354578.png
1642032387844.png
1642032433820.png
Cheers.
DrB
 
Hi Dr, I follow Commsec's chart every day. Where do you get the Trading chart? Can see both charts showing 2 different prediction, it's quite confusing n scary.
Hi Rabbit,
Sorry M8, just looked back on a few posts and noticed that I did not reply to your Question - " Where do you get the Trading chart?".
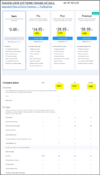
Try this link https://www.tradingview.com .

The Basic (FREE) version is OK - I prefer the Premium + Live Data.

1642476974460.png
 
I posted the following into the NCM - Newcrest Mining forum a few minutes ago.
For transparency, I am reposting it here within the DrB TA forum.

"Hi rederob.
You posted the following on 7/1/22 where you asked "Why he (DrB) used a Daily Chart when an hourly chart seemed to give a better picture of short term trends", Not sure why you would think that I don't use shorter term charts, everybody uses shorter term charts, that's just part of the Basic TA Training.
1642639409281-png.png


Well M8, I answered your question 2 days before you asked it, see my post (below) dated 5/1/22.
1642639754982-png.png


Now you can see some of what you are missing out on.
had you not been so agressive you may still be in the loop, and maybe you would learn some alternative approaches that may help your current trading practices.

Promise to behave yourself and maybe I could hit the "unignore" button.

Cheers,
DrB"
 
Now you can see some of what you are missing out on.
had you not been so agressive you may still be in the loop, and maybe you would learn some alternative approaches that may help your current trading practices.

Promise to behave yourself and maybe I could hit the "unignore" button.

I made valid comments about your inability to to show what Commsec got wrong, your BS idea that TA can be used for contrarianism, and the fact that you don't even follow your own trading rules, amongst other things. Your idea that I was aggressive towards you exists only in your mind.

That said, I have not seen any evidence from you that you understand how people learn and would propose that anyone wanting to practise the many things you cover should consider instead going to any of the thousands of great YouTube videos that explain purpose, rationale and deployment in trading rather than just what the indicator means.

An earlier post from @tech/a in this thread which I gold starred summarised my thoughts. As you may have may have discovered, I don't need you to "unignore" me as I can post as I wish unless @Joe Blow decides otherwise.
 
As I’ve mentioned in previous posts, I will visit ASF every so often just to check for any “questions from beginners”.

There is no point in me posting anything new.

Cheers.

DrB.
 
Top