Australian (ASX) Stock Market Forum

DrBourse TA Help for Beginners

And here is another example of when to avoid the P & K Candle Patterns.
20220920 ANSLY OTC Cht with K&P.jpg
As you can see ANN (ANSLY on theOTC as an ADR) is a very confused stock.
 
For those of you interested in Candlesticks, the following chart of the XJO is a great example of what is known as a “BENCHMARK CANDLE, & SECONDARY BENCHMARK CANDLES”.
20220929 XJO Benchmark Candles Example.jpg


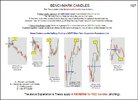
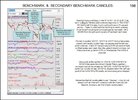
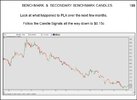
The following pages 197 to 199 explain how to read the “Benchmark”.
Page 197 Benchmark Candle 1.jpg
Page 198 Benchmark Candle 2.jpg
Page 199 Benchmark Candle 3.jpg
I will add that the 3 Day Rule seems to be stretching out to 4 or 5 Days since late 2019, our economic circumstances have changed dramatically over the past couple of years, and so have some of the Commonly Accepted Parameters for TA Subjects like Indicators etc.

Cheers.
DrB
 
Last edited:
Hi Rabbit & Farm,

I posted this a few minutes ago, not sure where it went, Cyberspace I guess, so reposting it here.

Suggest Caution over the next few weeks - IMO, XJO is heading for a Double Bottom at about the 6400 region - Most stocks should follow that ST Pullback.
Best to Keep your Powder DRY in the ST.
View attachment 146063
Might also mention that IMO Most Stocks are Within or Below their IV Ranges ATM.
Cheers
DrB
As a follow-up to my call on 29/8/22 for theXJO Chart, the following Chart comfirmed my call.
20221003 XJO Chart.jpg
Anyone out there game enough to make a call on "where to next for the XJO".
I have my own opinion on what will happen next, but I am interested in what you think.
Cheers.
DrB
 
yes , UP and for all the very worst reasons , especially considering this is the day before RBA rates day ( and potentially the last rate move for this calendar year )

however i wonder if this is any more than a blip ( or manipulation ) in a major trend
 
As a follow-up to my call on 29/8/22 for theXJO Chart, the following Chart comfirmed my call.
View attachment 147604
Anyone out there game enough to make a call on "where to next for the XJO".
I have my own opinion on what will happen next, but I am interested in what you think.
Cheers.
DrB
Hi Dr. I am not game to make a call. Tues maybe be another blood bath day for us unless tonight Monday, DJ do a high jump (Fri was a big drop of 500 pts)
 
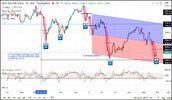
This XJO Chart is a pretty good example of how the Benchmark Candlestick Formation works by providing Upper, Middle, & Lower Sup/Res Lines.
20221021 XJO Chart.jpg
 
Could be something brewing with LNK.......
Not much in the way of announcement updates.......AND, Personally, I'm not a fan of LNK - BUT - for the devoted LNK Punters, there are Lots of ST TA signals appearing out of nowhere.......
For example :-
Higher Highs, Higher Lows, Flagpole & Pennant, Rising Triangle, Piercing Candle Formation, Containment Candles Breakout,
All those TA Signals (and a few others) are explained in previous pages within this "DrB TA Help for Beginners" Forum.
ST TA Points to abt $4.00, LT could be much higher if favourable Announcements lob.

A Problem TA Signal is that Large Gap Down on 13/9/22 which produces a Minor Res Line @ $3.58, and the Major Res Line @ $4.48.....

Previous examples of the Piercing Candle Formation make for interesting research opportunities.
20221105 LNK Cht.jpg

Remember that the above is just the "Ramblings of a guy on a Cruising Holiday".....
Remember my TA is not a reco' to buy......
REMEMBER TO DYOR.
 
DrBourse
Seen any Mermaids during the cruise ? :)

When you back?? Was hoping, you might have a look please at Newcrest, as it is doing thy head in.
Stay safe cruising the seven seas...
Farmerge sends his regards, he is a great grandfather now...

Kind regards
rcw1
 
DrBourse
Seen any Mermaids during the cruise ? :)

When you back?? Was hoping, you might have a look please at Newcrest, as it is doing thy head in.
Stay safe cruising the seven seas...
Farmerge sends his regards, he is a great grandfather now...

Kind regards
rcw1
Depends on how much alcohol I have M8...... Lotsa Black Douglas (BD) = Lotsa Mermaids.
Last cruise finishes just B4 Xmas - so may be back here early 2023 - on the other hand if the Cruise Ships run outa BD I may drop in sooner.

Have not seen much of Farm since the bad ole CommSuc Days, say Hi 4 me, and welcome to the Grumpy Great Grandad Club.

NCM seems to have found support around it's IV of $16.35 to $18.55, Higher Lows & Higher Highs are abt the only TA Highlights atm.
No real reason to expect high $20's anytime soon - IMO their Dec Half Yrly Report (due late Feb) may be a turning point.
20221105 NCM Cht.jpg

CYA
 
T
Depends on how much alcohol I have M8...... Lotsa Black Douglas (BD) = Lotsa Mermaids.
Last cruise finishes just B4 Xmas - so may be back here early 2023 - on the other hand if the Cruise Ships run outa BD I may drop in sooner.

Have not seen much of Farm since the bad ole CommSuc Days, say Hi 4 me, and welcome to the Grumpy Great Grandad Club.

NCM seems to have found support around it's IV of $16.35 to $18.55, Higher Lows & Higher Highs are abt the only TA Highlights atm.
No real reason to expect high $20's anytime soon - IMO their Dec Half Yrly Report (due late Feb) may be a turning point.
View attachment 148859

CYA
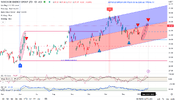
Ta mate much appreciated
Safe travels.

Kind regards
rcw1
 
Hi rcw,

Thought I would chuck my thoughts on WDS into your court.

ST TA does not look very good for WDS atm.

Candle for today, 18/1/23 @ 10.45am is whats known as a “Dark Cloud Cover” ( or Bearish Piercing).

The Benchmark Candles (pages 197 to 202) for 6/1/23 to 17/1/22 suggest Support Levels @ $35.75, then $33.91, AND the June 22 Benchmark Candles provides 2 more support levels @ $32.48 & $29.22.

I would expect WDS to Bounce off one of those Support Levels, just not sure which one.

Remember that as at 30/10/22, The WDS IV was calculated at Between $35.03 & $38.62, so WDS is Fairly Priced atm.

The CCI Indicator is not happy at all.

The Red & Blue markers are my Buy/Sell points.

I have a Long Term Target Price of $46.11

1674003295293.png

Cheers .
 
Hi rcw,

Thought I would chuck my thoughts on WDS into your court.

ST TA does not look very good for WDS atm.

Candle for today, 18/1/23 @ 10.45am is whats known as a “Dark Cloud Cover” ( or Bearish Piercing).

The Benchmark Candles (pages 197 to 202) for 6/1/23 to 17/1/22 suggest Support Levels @ $35.75, then $33.91, AND the June 22 Benchmark Candles provides 2 more support levels @ $32.48 & $29.22.

I would expect WDS to Bounce off one of those Support Levels, just not sure which one.

Remember that as at 30/10/22, The WDS IV was calculated at Between $35.03 & $38.62, so WDS is Fairly Priced atm.

The CCI Indicator is not happy at all.

The Red & Blue markers are my Buy/Sell points.

I have a Long Term Target Price of $46.11

View attachment 151817

Cheers .
OMG got a small parcel of it fr BHP, was going to hold for long term, pending on whether I need cash. If so, was going to dump if I cld get 10k out of it. The mind boggles.
 
OMG got a small parcel of it fr BHP, was going to hold for long term, pending on whether I need cash. If so, was going to dump if I cld get 10k out of it. The mind boggles.
despite the SP rise , WDS has nearly always disappointed me ( before and after the BHP spin-off ) ( i hold WDS )

am not so sure i will hit the exit button ( near or mid-term ) but will not be looking to add ( more than my DRP participation )

IN THEORY WDS should have benefited from cherry-picking the best of the BHP Petroleum staff , i am still waiting to see what actually happens
If I do exit, the sum of it will enter BHP. My thought is somewhat with yours n surely oil will be in demand once the global issues settle.
It is not impossible to see that approx indication long term price fr Dr B.
 
If I do exit, the sum of it will enter BHP. My thought is somewhat with yours n surely oil will be in demand once the global issues settle.
It is not impossible to see that approx indication long term price fr Dr B.
i already have a comfortable amount of BHP ( i even resisted joining the DRP )

to ME , BHP ( currently ) looks to me like a 'serial stumbler ' much like modern WOW

i would be ( currently ) more inclined to add the profits in extra S32 ( and MAYBE even part of the OZL proceeds , when they arrive )

as i think i need a little extra growth in my portfolio ( to help resist inflation )

now oil price .....

i see a disconnect coming as much of the OPEC+ production will circumvent the Petro-dollar and therefore the major commodity markets ( Singapore might be a BIG winner here ) funneling much refining activity to India and China

will the oil rice become just as notional as the 'official' gold price ( very different from what the retail buyer can take it home for )

BTW i do not debate Dr. B's calculations , only what I would do if they come true

i also notice an uptick in talk about uranium , keep an eye on BHP to see if they expand Olympic Dam , there is a useful amount of uranium there ( allegedly )
 
Hi rcw,

Thought I would chuck my thoughts on WDS into your court.

ST TA does not look very good for WDS atm.

Candle for today, 18/1/23 @ 10.45am is whats known as a “Dark Cloud Cover” ( or Bearish Piercing).

The Benchmark Candles (pages 197 to 202) for 6/1/23 to 17/1/22 suggest Support Levels @ $35.75, then $33.91, AND the June 22 Benchmark Candles provides 2 more support levels @ $32.48 & $29.22.

I would expect WDS to Bounce off one of those Support Levels, just not sure which one.

Remember that as at 30/10/22, The WDS IV was calculated at Between $35.03 & $38.62, so WDS is Fairly Priced atm.

The CCI Indicator is not happy at all.

The Red & Blue markers are my Buy/Sell points.

I have a Long Term Target Price of $46.11

View attachment 151817

Cheers .
Good evening @DrBourse,

Wasn't so long ago that Woodside struck the $16 level. Recall it well as bought in and sold pretty soon afterwards as the SP bounced back into the $20 plus range. Allot of water has flowed under the bridge since then. Bounce $34 - $34.90

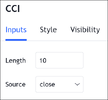
How many periods did you use to calculate the CCI Index? trend
Entry and exist points look good to rcw1 well done.
$46.11, for mine, will take some doing...

Kind regards
rcw1
Hi rcw.
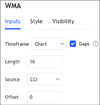
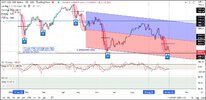
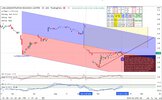
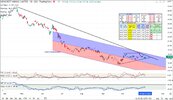
Look at any of my past charts, then look at the LEFT for the CCI, I use a CCI 10 Based on the days Close, with the Top Band @ 100, and the Bottom Band @ Minus100, - and a WMA 10 overlaid on the CCI..... and ocasionally I add a Centreline @ Zero, and then just for kicks I flick to Tick, Minute, Weekly, & Mthly Charts to get a better view of what the CCI is telling me...
1674080373289.png
1674080275486.png
1674080242343.png
Remember that I use the Trading View Software with all the Bells & Whistles, dunno what the Basic Free version provides.
Cheers M8
 
Hi rcw.
Look at any of my past charts, then look at the LEFT for the CCI, I use a CCI 10 Based on the days Close, with the Top Band @ 100, and the Bottom Band @ Minus100, - and a WMA 10 overlaid on the CCI..... and ocasionally I add a Centreline @ Zero, and then just for kicks I flick to Tick, Minute, Weekly, & Mthly Charts to get a better view of what the CCI is telling me...
View attachment 151849
View attachment 151848
View attachment 151847
Remember that I use the Trading View Software with all the Bells & Whistles, dunno what the Basic Free version provides.
Cheers M8
K thanks. Just wanted to confirm, did see the 10 within the CCI.
WOPEF -2.41%
UK WDS -1.87%

Have a very nice day, today, DrBourse.

Kind regards
rcw1
 
Top