Australian (ASX) Stock Market Forum

DrBourse TA Help for Beginners

Just for all the beginners out there and I am sure @DrBourse would agree, stock picking future price is a notoriously fickle art should success be your metric.

Having said that, Technical Analysis (TA) is better imo for picking targets and supports and sell levels than fundamental analysis in Australian stocks.

Also @DrBourse posts may be suitable for the more advanced beginner and if you are a beginner and confused by the plethora of information and indicators there are many beginners threads on ASF which go in to TA and of course many educational books available from bookshops and libraries for beginners.

gg
Hi @Garpal Gumnut Just gave you a 'Like' for your above post, BUT, on reflection I would like to explain my perspective on the subject of "stock picking future price"....

IMO, when using TA, it is reasonably easy to Calculate a Stocks Future Price, Recent stocks where I have done exactly that include, CSL with 13 correct calls since mid 2023 to today (28/6/24) when CSL hit $298.00, then for ATC 12 mths ago I called 8 price levels that ATC would pullback to, thats just 2 of dozens of correct Price Calls that I have made.....

On the other hand, Calculating or Calling Exact Future Dates for those Price Calls is an entirely different & difficult thing to do.... I calculated that my ATC call would take 6 mths, Wrong, it took 12 mths, but the Dollar Values were spot on.... I was much closer with the CSL Future dates....

Then you also mentioned that "Technical Analysis (TA) is better imo for picking targets and supports and sell levels than fundamental analysis in Australian stocks"..... Ratios, Margins of Safety and other Info, such as Market Depth are used to help locate Support & Resistance Lines, SO, Again I would have to disagree with you, Brokers & Analysts in general would disagree with you, they make those calls every day based Primarily on FA, BUT also based on TA, plus any other Info (like Guesstimates) they can get their hands on....

Brokers & Analysts calculate their Target Prices, But I use Primarily FA, and to a lesser extent TA (60% FA & 40% TA) to calculate the other end of the spectrum, Intrinsic Values - all those processes are fully explained within my 3 Dr.B Beginners Lounge Forums....

It's just a matter of what we as individuals learn and master about the workings within the ASX Sandpit.....

Cheers M8..
DrB.
 
This is a follow-up to my above post #285 on 17/6/24 Re the “DrB 3 Indicators”…..

In that post I mentioned 2 areas that this post will address….

The first was where I said, “There are other Signals given by the 3 Indicators, such as”….

And then, “There are also numerous other signals that can be observed on a Chart”….


So, to expand on those 2 statements I submit the following:-

To start with, let’s just look at how those 2 highlighted statements help or hinder the DMI…
.

The DMI gives several Entry/Exit Signals as set out in the snapshot below….

View attachment 178866

The above Snapshot does not list the following:-

The DMI indicator is made up of three plots; the difference between today's high and yesterday's high is the up movement or D+, the difference between today's low and yesterday's low is the down directional movement or D-. Finally, the ADXR (Directional Index) is calculated by taking the averages of the D+ and the D- and dividing them by the average true range.

Suggested terms are 13 or 14…. HOWEVER, after many years back-testing the DMI I found that a term of 7 works best for me….

Remember that People usually read all about Indicators, that's great, but what people need to do is spend a lot of time STUDYING Indicators, reading will give you the basic's, as a trader you need more than just the basic's, just because a book suggests to you that, for example, O'bought & O'sold lines are set at a particular level, it does not make that suggestion correct or incorrect, it's just a guide, a reference point, a starting point, nothing is 'set in concrete' - look at the Indicator Formulas, understand them, understand what the Indicator uses to calculate it's individual 'End Point' - use that understanding to gain an advantage over other traders.... Don't get me wrong here - by all means use the Normally Accepted Settings to start with, then as you become more proficient, expand your horizons, experiment with different terms and settings.

A rising ADXR, with both the ADXR and D+ above the D- indicates a strengthening bullish market.

A rising ADXR, with both the ADXR and D- above D+ indicates a strengthening bearish trend.

If the ADXR has been below both D+ and D- but has begun to rise, a new market trend is emerging.

A Declining or Low ADXR shows that the market is losing its direction.

When ADXR falls below both D+ and D- it signals a lifeless market.

Do not trade with DMI until ADXR has clearly turned off the bottom.

Wait until ADXR rises 4 steps off its low (ie: 15 is its low point).

The longer that ADXR has remained below both D+ and D- the stronger the subsequent trend is likely to be.

When ADXR rises above both D+ and D- it signals that the market is becoming overheated. Take profits when ADXR turns down from above D+ and D-.

The ADXR is a component of the DMI.

The ADXR can be used as a filter with other indicators.

Remember, a low ADXR indicates a sideways market.

A rising ADXR indicates a strong trend, and a flat or falling ADXR indicates the trend may be failing.

Suggested term = 13….. HOWEVER, after many years back-testing the DMI I found that a term of 7 works best for me….

View attachment 178867

Very Basically, when you look at the DMI and its 3 Lines, all you need to do is relate the configuration of the 3 lines to the actual SP for that same period – on the chart above, for the period from 20/9/23 to 3/11/23 you will see that the DMI shows RED & BLUE Lines are ABOVE the GREEN and the SP has Pulled Back considerably….

Now look at the period 3/11/23 to 11/1/24 where you will see that the DMI shows GREEN & BLUE Lines ABOVE the RED and the SP has Risen substantially….

Now look at the period from about 28/2/24 to today 17/6/24 where you will see that the 3 DMI Lines are bunched together, at what I would call Mid Range, and the SP has been Trending Sideways for that entire period….

Note that the period from 11/1/24 to 28/2/24 the DMI gave a few "Non-descript Mixed Signals"….

Cheers..
DrB.
This is an updated version of the "Basic Rules for the DMI Indicator" that I last posted 18/6/24, page 15, post#287.....
Some punters found the earlier versions as a bit complicated....
This time I have given each Signal an Identifying Number for ease of reference.....

.DMI - Basic Rules for the DMI Indicator 20240722.png

Dr.B
 
Here is an interesting look at the same chart from 2 different perspectives….
Which chart suits your style of TA…..

This 1st Chart shows that RRL is DOWN by $0.02c @ about 2.20pm today – That would BAD Day for most stocks…. That’s a pretty big Red Candle for just a $0.02c pullback so far today….
RRL Cht 20240819.png

This 2nd Chart shows that RRL is having a better day – The candle says it all…. RRL is up by $0.075c for the day, so far....
RRL Cht 20240819 (2).png

Personally, I use the 2nd Chart setting…. I reckon RRL is having a great day so far… Bad News has been rejected by the RRL holders…. The SP has bounced off that small Minor Support Line @ $1.555c…. I need to know what is happening with a stock today, it makes little difference to me how the Share Price today relates to yesterdays close…. I can gauge the public’s feeling towards a stock from Todays Candle, without that candle being dictated to by Yesterdays Close…

Which suits your style of TA better….

Here is what causes the difference is between the 2 charts…
These are the Settings for the 1st Chart with the RED Candle....
RRL Cht 20240819 (3).png


These are the Settings for the 2nd Chart with the Green Candle...
RRL Cht 20240819 (4).png

Each Chart is Correct, it just depends on your personal requirements...
Having said that, you must be careful that you don't marke the wrong decisions when trading..
Don't just blindly accept whatever Chart Settings you are provided with, Check out the Settings, are they the Settings you want or need....

Cheers..
DrB
 
Last edited:
Here is an interesting look at the same chart from 2 different perspectives….
Which chart suits your style of TA…..

This 1st Chart shows that RRL is DOWN by $0.02c @ about 2.20pm today – That would BAD Day for most stocks…. That’s a pretty big Red Candle for just a $0.02c pullback so far today….
View attachment 182806

This 2nd Chart shows that RRL is having a better day – The candle says it all…. RRL is up by $0.075c for the day, so far....
View attachment 182807

Personally, I use the 2nd Chart setting…. I reckon RRL is having a great day so far… Bad News has been rejected by the RRL holders…. The SP has bounced off that small Minor Support Line @ $1.555c…. I need to know what is happening with a stock today, it makes little difference to me how the Share Price today relates to yesterdays close…. I can gauge the public’s feeling towards a stock from Todays Candle, without that candle being dictated to by Yesterdays Close…

Which suits your style of TA better….

Here is what causes the difference is between the 2 charts…
These are the Settings for the 1st Chart with the RED Candle....
View attachment 182809


These are the Settings for the 2nd Chart with the Green Candle...
View attachment 182810

Each Chart is Correct, it just depends on your personal requirements...
Having said that, you must be careful that you don't marke the wrong decisions when trading..
Don't just blindly accept whatever Chart Settings you are provided with, Check out the Settings, are they the Settings you want or need....

Cheers..
DrB
Refer to my previous post #307.....
The Chart below goes to show what results you can get "IF you use the correct Chart" and "IF you understand TA".....
1724200955686.png
So we are now looking at a "Loss of Momentum" being displayed by the last 2 Green Candles (see page 17)... B Careful....

Cheers..
DrB
 
NO, Not yet, I just ammended my last post, read the last line...
C'Mon Rabbit, remember you taught me everything I know abt TA....
Look at the DMI Signals....
 
Refer to my previous post #307.....
The Chart below goes to show what results you can get "IF you use the correct Chart" and "IF you understand TA".....
View attachment 182907
So we are now looking at a "Loss of Momentum" being displayed by the last 2 Green Candles (see page 17)... B Careful....

Cheers..
DrB
As a follow-up to my recent posts on RRL….

Sellers are in control so far today, and that BCF Middle Sup/Res Line is worrying the punters…

And to think that most inexperienced people thought that candle back on 19/8/24 was RED…. BIG MISTAKE…. (see my post #307 19/8/24)….. HUGE MISTAKE…..
1724648594317.png
Now we have the CCI Still Rising, The DMI has Blue & Green above the RED (Nr 2) and the MFI is still above its Centreline - looking good, but watch out for Profit Takers...
1724648931014.png
Wait for the CCI, DMI & MFI Confirmation Exit Signals....
 
As a follow-up to my recent posts on RRL….

Sellers are in control so far today, and that BCF Middle Sup/Res Line is worrying the punters…

And to think that most inexperienced people thought that candle back on 19/8/24 was RED…. BIG MISTAKE…. (see my post #307 19/8/24)….. HUGE MISTAKE…..
View attachment 183189
Now we have the CCI Still Rising, The DMI has Blue & Green above the RED (Nr 2) and the MFI is still above its Centreline - looking good, but watch out for Profit Takers...
View attachment 183191
Wait for the CCI, DMI & MFI Confirmation Exit Signals....
Thanks Doc,

If you could throw an RSI in some of your charts I'd appreciate it. It is the only momentum indicator I use. Keep up the interesting posts.

gg
 
Thanks Doc,

If you could throw an RSI in some of your charts I'd appreciate it. It is the only momentum indicator I use. Keep up the interesting posts.

gg
Hi @Garpal Gumnut ,….

B4 I start to show the RSI on any of my charts, I need to clarify a few things…..

The RSI Explanations….

Results produced by any Indicator depends on the individual Indicator Settings…..

And in some instances there are multiple versions available: - RSI has 2 versions readily available, and a few more that are difficult to locate, so you may occasionally get different results.

The Basic Formula is - RSI = 100 - 100/(1 + RS*).... - *Where RS = Average of x days' up closes / Average of x days' down closes.

The other Formula is much more complex and rarely used.

I should mention that there are “Several Different RSI Formulas”…. The RSI was originally developed by J.Wells.Wilder….

Try this site for an explanation http://www.investopedia.com/terms/r/rsi.asp - or just google “RSI Indicator” for dozens of other sites that explain the RSI.

Then there were other RSI Versions by a Mr Cutler, then there appeared another several new interpretations from a Mr Andrew Cardwell….

Info on the above versions can be found in this link:-

https://en.wikipedia.org/wiki/Relative_strength_index

Or if you have access to configurable Indicator Settings for RSI - try the following combinations.

ST (1 to 5 Trading Days) A Term of 7 with a 7WMA, with O'Bought @ 80 & O'Sold @ 20 –

MT (6 to 20 Trading Days)A Term of 14 or 15 with a 15WMA, with O'Bought 70 & O'Sold 30 –

LT (21 or more Trading Days) try the 14 or 15 and a 50WMA, but use a CentreLine in lieu of O'Bought/O'Sold lines…

Remember that all those different versions produce slightly different results.

And remember that Analysts, Brokers and Software Providers all choose the RSI most flattering to their own publication....

I used to have a list of some more versions – but I have misplaced that list, last saw it about 20 years ago – dunno where it is now…


Questions 4 U….

Which version of the many RSI’s do you use, as they will all produce slightly different results….

What Overbought/Oversold settings do you use, and do you use a Centreline setting….

Have you ever tried using a WMA (instead of the “Dull & Booring SMA or EMA”, within whatever RSI version you use, and do you use a Moving Average of any type on Top of your RSI Indicator…..

Do you use Smoothing on your Chosen RSI – if so, WHY!!!!!


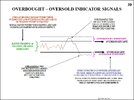
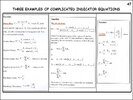
Things that U should be aware of, & explain how to read Indicators….

Page 037 Indicator Signals 1.JPG
Page 038 Indicator Signals 2.JPG
Page 039 Indicator Signals 3.JPG
Page 040 Indicator Signals 4.JPG
Page 041 Indicator Signals 5.JPG
Page 042 Indicator Signals 6 - Copy.JPG
Page 043 Indicator Signals 7.JPG
Page 044 Smoothing.JPGPage 047 Indicator Equations.JPGPage 098 RSI Indicator.JPG
Page 118 Indicator Pos and Neg Signals.JPGPage 119 Indicator Combinations.JPG


There are several other problems with the RSI that I don’t have the Time or inclination to explain….

Not sure why people that use “Old Hat/Ancient” Indicators like the RSI, MACD & the Stochastics, they should all be relegated to the Caveman Days….

I think that has given you enough to think about, in the meantime I will TRY to add “the RSI I used 50 years ago”, into some of my charts…

Cheers M8…
 
Last edited:
Hi @Garpal Gumnut ,….

B4 I start to show the RSI on any of my charts, I need to clarify a few things…..

The RSI Explanations….

Results produced by any Indicator depends on the individual Indicator Settings…..

And in some instances there are multiple versions available: - RSI has 2 versions readily available, and a few more that are difficult to locate, so you may occasionally get different results.

The Basic Formula is - RSI = 100 - 100/(1 + RS*).... - *Where RS = Average of x days' up closes / Average of x days' down closes.

The other Formula is much more complex and rarely used.

I should mention that there are “Several Different RSI Formulas”…. The RSI was originally developed by J.Wells.Wilder….

Try this site for an explanation http://www.investopedia.com/terms/r/rsi.asp - or just google “RSI Indicator” for dozens of other sites that explain the RSI.

Then there were other RSI Versions by a Mr Cutler, then there appeared another several new interpretations from a Mr Andrew Cardwell….

Info on the above versions can be found in this link:-

https://en.wikipedia.org/wiki/Relative_strength_index

Or if you have access to configurable Indicator Settings for RSI - try the following combinations.

ST (1 to 5 Trading Days) A Term of 7 with a 7WMA, with O'Bought @ 80 & O'Sold @ 20 –

MT (6 to 20 Trading Days)A Term of 14 or 15 with a 15WMA, with O'Bought 70 & O'Sold 30 –

LT (21 or more Trading Days) try the 14 or 15 and a 50WMA, but use a CentreLine in lieu of O'Bought/O'Sold lines…

Remember that all those different versions produce slightly different results.

And remember that Analysts, Brokers and Software Providers all choose the RSI most flattering to their own publication....

I used to have a list of some more versions – but I have misplaced that list, last saw it about 20 years ago – dunno where it is now…


Questions 4 U….

Which version of the many RSI’s do you use, as they will all produce slightly different results….

What Overbought/Oversold settings do you use, and do you use a Centreline setting….

Have you ever tried using a WMA (instead of the “Dull & Booring SMA or EMA”, within whatever RSI version you use, and do you use a Moving Average of any type on Top of your RSI Indicator…..

Do you use Smoothing on your Chosen RSI – if so, WHY!!!!!


Things that U should be aware of, & explain how to read Indicators….

View attachment 183228
View attachment 183229
View attachment 183230
View attachment 183231
View attachment 183232
View attachment 183233
View attachment 183234
View attachment 183235View attachment 183236View attachment 183237
View attachment 183238View attachment 183239


There are several other problems with the RSI that I don’t have the Time or inclination to explain….

Not sure why people that use “Old Hat/Ancient” Indicators like the RSI, MACD & the Stochastics, they should all be relegated to the Caveman Days….

I think that has given you enough to think about, in the meantime I will TRY to add “the RSI I used 50 years ago”, into some of my charts…

Cheers M8…
Mate, with respect, I haven't read that.

Just the stock RSI that everyone uses.

In anticipation and thanks for your diligence.

Its just for my use. I'm not in to education or biblical interpretation.

gg
 
Top