Australian (ASX) Stock Market Forum

DrBourse TA Help for Beginners

I do not use a Conventionally Accepted Stop Loss or Trailing Stop Loss System…I feel that those systems belong to the Longer Term Investors…Once I have in my opinion, enough Signals/Signs from my Tools of Trade, I will act immediately…For example if a Bearish Candle Pattern and/or my Indicators suggest that a pullback or downtrend is imminent I will follow those signals and exit the Trade immediately…If I were to use a % Stop Loss System (of say 2%) and my Tools of Trade gave me enough signals to exit for say 0.5%, I would be crazy to hold and watch any small loss be increased just because that “% Stop Loss System” told me I had to wait till my losses reached that magical 2% - it would be easier to just give some money away…Admittedly I sometimes exit a trade early – but I prefer to be cautious – and if my Tools of Trade suggest continued uptrend then I can easily re-enter the Trade.
"You can assist whatever Stop Loss System you use by "Correct Stock Selection" & "Correct $$ Management" - for example - If you invest $50k in Penny Dreadful’s like LKO shares you will probably activate your Stop Loss System immediately, and if you are not quick enough you could lose the lot - On the other hand $50k invested in BHP shares would be a safer trade, less risk, probably less profit but better protection for your capital“.
IMO, Traders should not get too involved with Stop Loss points - I do not use a Conventionally Accepted Stop Loss or Trailing Stop Loss System….I feel that those systems belong to the Longer Term Investors….Once I have in my opinion, enough Signals/Signs from my Tools of Trade, I will act immediately….For example if a Bearish Candle Pattern and/or my Indicators suggest that a pullback or downtrend is imminent I will follow those signals and exit the Trade immediately....If I were to use a % Stop Loss System (of say 2%) and my Tools of Trade gave me enough signals to exit for say 0.5%, I would be crazy to hold and watch any small loss be increased just because that “% Stop Loss System” told me I had to wait till my losses reached that magical 2% - it would be easier to just give some money away....Admittedly I sometimes exit a trade early – but I prefer to be cautious – and if my Tools of Trade suggest continued uptrend then I can easily re-enter the Trade....- the idea is to trade when there is a trade to be made, and even then you should 'Play the Trade' (like playing a Fish), you should not trade the $$$'s - get the trades right and the $$$'s will automatically follow.
Most Traders use strict Stop Loss systems I primarily use my Indicators as my initial Stop Loss System, when they turn Negative, I jump - the other system is a "TSL" = Trailing Stop Loss of a $/c value - so had everybody been using some sort of Stop Loss they would have a small Trading Loss to use as a Tax Ded'n -
"You can assist whatever Stop Loss System you use by "Correct Stock Selection" & "Correct $$ Management" - for example - If you invest $50k in LKO shares you will probably activate your Stop Loss System immediately, and if you are not quick enough you could lose the lot - On the other hand $50k invested in BHP shares would be a safer trade, less risk, probably less profit but better protection for your capital".

Suggest that you try this site http://www.incrediblecharts.com/ , lots of FREE Educational Info...On the Incredible Charts Home page, top right hand side, do a search for ‘Stop Loss’...
Also see my Snapshots 112, 116 & 160...Then do a Google Search for Stop Loss - dozens of good explanations there...

A lot of Day Traders prefer to use alarms rather than Stop Loss Triggers..... Most of the Software Trading Platforms (Metastock, Incredible Charts, etc) have an alarm system that may be of use to you..... I have an average of 20-25 alarms that I review Daily.... You can usually set these alarms on a SP, an Open, a Close, a High, etc, some can be set for release of an announcement - lots of other parameters may be available depending on the program.... the obvious drawback with alarms is that you have to be online when the alarm is triggered for it to be of any value...
 
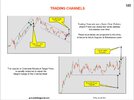
Trading Channels.
 

Attachments

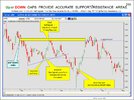
  • Page 185 Trading Channels.JPG
    Page 185 Trading Channels.JPG
    151.8 KB · Views: 25
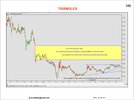
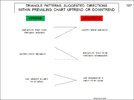
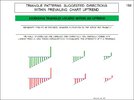
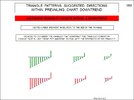
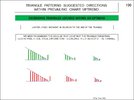
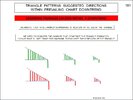
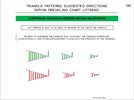
Triangles.
 

Attachments

  • Page 186 Triangles.JPG
    Page 186 Triangles.JPG
    122.5 KB · Views: 20
  • Page 187 Triangles 1.JPG
    Page 187 Triangles 1.JPG
    67 KB · Views: 19
  • Page 188 Triangles 2.JPG
    Page 188 Triangles 2.JPG
    81.4 KB · Views: 16
  • Page 189 Triangles 3.JPG
    Page 189 Triangles 3.JPG
    82.5 KB · Views: 14
  • Page 190 Triangles 4.JPG
    Page 190 Triangles 4.JPG
    81.1 KB · Views: 14
  • Page 191 Triangles 5.JPG
    Page 191 Triangles 5.JPG
    84.4 KB · Views: 14
  • Page 192 Triangles 6.JPG
    Page 192 Triangles 6.JPG
    137.3 KB · Views: 22
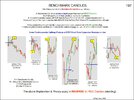
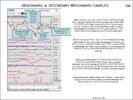
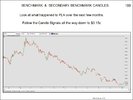
Benchmark Candles & Secondary Benchmark Candles.
 

Attachments

  • Page 197 Benchmark Candle 1.JPG
    Page 197 Benchmark Candle 1.JPG
    110.5 KB · Views: 24
  • Page 198 Benchmark Candle 2.JPG
    Page 198 Benchmark Candle 2.JPG
    148.8 KB · Views: 23
  • Page 199 Benchmark Candle 3.JPG
    Page 199 Benchmark Candle 3.JPG
    75.6 KB · Views: 26
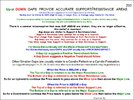
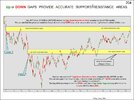
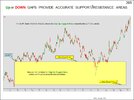
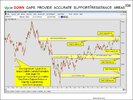
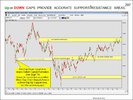
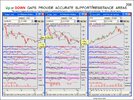
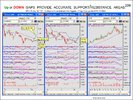
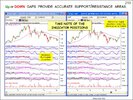
UP & DOWN GAPS.
 

Attachments

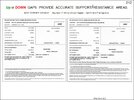
  • Page 203 Gaps 1.JPG
    Page 203 Gaps 1.JPG
    172.3 KB · Views: 23
  • Page 204 Gaps 2.JPG
    Page 204 Gaps 2.JPG
    111.9 KB · Views: 22
  • Page 205 Gaps 3.JPG
    Page 205 Gaps 3.JPG
    81.1 KB · Views: 17
  • Page 206 Gaps 4.JPG
    Page 206 Gaps 4.JPG
    113.6 KB · Views: 17
  • Page 207 Gaps 5.JPG
    Page 207 Gaps 5.JPG
    108.2 KB · Views: 17
  • Page 208 Gaps 6.JPG
    Page 208 Gaps 6.JPG
    178.1 KB · Views: 18
  • Page 209 Gaps 7.JPG
    Page 209 Gaps 7.JPG
    181.7 KB · Views: 18
  • Page 210 Gaps 8.JPG
    Page 210 Gaps 8.JPG
    158.4 KB · Views: 16
  • Page 211 Gaps 9.JPG
    Page 211 Gaps 9.JPG
    115.2 KB · Views: 17
  • Page 212 Gaps 10.JPG
    Page 212 Gaps 10.JPG
    103.6 KB · Views: 23
I rely heavily on a 3 indicators combination, a CCI (10) and an MFI (30) below the chart, and a 30 day Linear Regression on the chart.
I've found over the years that the CCI is not always available on some platforms (Commsuc for example).
In the absence of the CCI, I find that a Will%R (12 or 13) gives a very similar indicator End Point as the CCI (10)
 
Hi DrBourse, I think that your heart is in the right place but it may be better to put up little bit of education and see what feedback you get from people, then if and when they want more, move on to the next part.
Hi DT,
Sorry M8, not my style, prefer to post the lot in one hit then after the 'Point Scorers' finish, we can hopefully move on to some "constructive discussions" with the beginners.
Been doing this for many years now, found that most beginners want the lot 'up front', like in a Seminar, they can then digest it at their leisure.
Cheers..
 
The 3 “DrBourse Help For Beginners” forums ALL contain a series of “RANDOM POSTS” on subjects and items that may be of interest to beginners…

My intention is to lodge numerous posts to start with, then enter into “CONSTRUCTIVE DISCUSSIONS” that are geared toward assisting with beginner’s education in the various aspects of Share Trading….

These posts are not intended to be in any logically presented format….

Experienced Traders will gain little from my posts….
 
Sounds a lot like theory rather than a proven trading methodology.

What in your opinion is your market edge?
Can you trade a few charts to show your ideas or trading method
Similar to Pete 2 and a few others here.
Been proving it to hundreds of traders and a few brokers over the past 30+ years.
Don't feel the need to prove anything to anybody anymore.

BUT, see my post above dated July 24 2021 regarding pages 203 to 212.

My market edge is in helping to raise all beginners knowledge of share trading up to your illustrious level.
 
Been proving it to hundreds of traders and a few brokers over the past 30+ years.
Don't feel the need to prove anything to anybody anymore.

Not asking for proof just practical application and if it doesn't work out how you handle it
and if it does work out how you handle that,and if it sits there doing very little how you handle that.

BUT, see my post above dated July 24 2021 regarding pages 203 to 212.

My market edge is in helping to raise all beginners knowledge of share trading up to your illustrious level.
I know you know what I mean and if your answer is honest then your presenting what you believe is a business
edge.
As for trading you dont seem to have one.


Beginners dont know what to ask
They dont know what they need to know and most importantly

They dont know what it is they dont need to know.

There are books, videos ,courses papers and a plethora of ideas on what is needed to trade profitably.
Many "Educators" purposely complicate so called "teaching" with ENDLESS levels which they have
newbies believe will lead them to know how to trade profitably.

To newbies the more complex it is the more valuable information they think is hidden in the Reams
of copy.

The truth is.
Profitable trading comes from

(1) Having more winning trades with accumulative trading profit higher than losing trades.
(2) OR Having larger winning trades that are greater than accumulated losing trades.
(3) OR Both.

So if your showing us how to do this ---what it is we have to know and there is MORE WE DON'T NEED TO KNOW
go ahead.
But presenting gap theory on page 210 has me perplexed as to the other 200 pages.

By the way there are buildings full of Quants,Scholars with economic doctorates employed by people with more money than
All of us on this web page---their research and implementation of millions of $$s of brain power often ekes out a little more than the Bourse being traded.

Personally The beginner traders I've met
aren't looking to increase their trading funds 12% a year
they want something substantial 30% or more.
Simplicity and individuality will get you there---not complexity.
Complexity will get you mediocrity at best!

You wouldn't be Paul Kronk from Cairns would you?
 
Last edited:
I would like to give Beginners a word of warning.


I recently came across a post from 15/3/21, the post read that :-

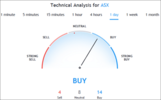
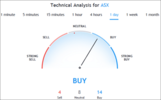
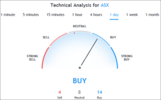
“I understand that technical indicator signals are not impressive for professional traders. But for beginners, this technical analysis will be very useful. For example,

1637194212202.png


A follow-up post lobbed a day later showing the Indicators used that produced that 14 Buys, 8 Neutrals & 4 Sells result.

1637194225080.png

My point is that beginners must be very careful when acting on "Unsolicited Buy/Sell Recommendations".

Here are my reasons for the warning:-


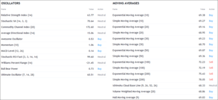
If you ever have to use numerous Oscillators, as in the above example, then you must ensure that they have Formulas that are based on different data.

1637194321390.png

The first 12 Moving Averages in the above example are virtually all the same, One would have been sufficient, which in turn would have lowered the Buy/Neutral/Sell ratio back to 8, 8 & 4.

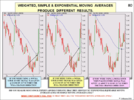
Then you would need to Question WHY use SMA & EMA, why not use WMA – The example below should give you something to think about.

1637194363929.png

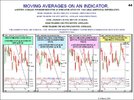
And using a Moving Average on an Indicator produces very good results, as shown in the next snapshot.

1637194777921.jpeg


Finally, you would need to question the Terms used for each indicator, because Software programs like this one
can be manipulated to produce a desired result.

1637194414846.png

If I were to shorten each indicator term to say to about 7, then the end result would be entirely different, probably 20 Sell, 3 Neutral & 3 Buy.

Also note that the differences between each EMA/SMA are miniscule in the overall view.


I guess what I’m trying to suggest is that Experienced Traders are well aware of the hazards in “Following Unsolicited Recommendations”.
BUT Beginners need to question everything,

Cheers.
DrB
 

Attachments

  • 1637194389648.png
    1637194389648.png
    303.3 KB · Views: 12
  • 1637194536648.png
    1637194536648.png
    31.6 KB · Views: 10
Last edited:
If anyone wants to follow a recent Trade of mine, go to the "FMG - Fortescue Metals" forum, pages 200 & 201 (and maybe page 202).
Not much point in me reposting everything here.
Cheers.
DrB.
 
Spent time recently looking back on old posts.

Noticed that there are a few chatters pointing out what they think is a Double Top or Bottom, when it is actually a Tweezer Top or Bottom.

Making a decision one way or the other on an incorrect TA identification can be fatal.

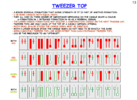
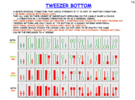
One of the Major Traps in identifying a Tweezer Top or Bottom is that most punters do not realise, or understand the implications involved, as there are more than 48 different connotations for each Tweezer Top, and 48 for each Tweezer Bottom that you may encounter.

Pages 13 & 14 below show the most common Tweezer Top & Tweezer Bottom formations.
1639525561611.png
1639525603328.png


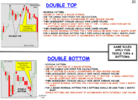
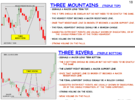
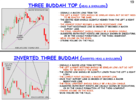
ALSO, I noticed that some punters get a bit confused with:-

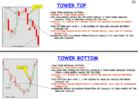
Double Tops & Bottoms (page 20), Triple Tops & Bottoms (page 18), Head & Shoulders (page 19), Tower Tops & Bottoms (page 23),
A quick look at the pages below may help those that are unsure of what each one means.

1639525673326.png
1639525722842.png
1639525779180.png
1639525833667.png
Cheers.
DrB
 
Good Day Dr. B and may I take this early opportunity to wish you and All members A Merry Christmas in this testing Pandemic time. Stay Safe and Stay Well.
Saw this section of your post while navigating my way. I am going to keep it for my holiday's reading, will pull out my file from the drawer.
LOL..printed your book you kindly emailing me on another Forum site.
 
31/12/21 12.55pm

Something for Beginners to think about when conducting their own TA Research.

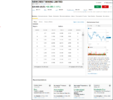
This first snapshot is from the CommSec/Quotes/Summary page where they share their Technical Analysis by saying:-
“NCM shares appear to be in a strong near-term rally within a longer-term bearish trend. The 200-day moving average is downward sloping and implies that there has been limited demand for this stock. However, the stock has been rallying recently. Although it is too early to tell whether this rally could be the beginning of a new long-term trend, the stochastic oscillator is overbought and tells us that this level of upward momentum is unsustainable. Investors should proceed with caution”.

They also suggest that the Analysts Consensus is as follows “Consensus 29 Dec 2021,10 Strong Buy, 2 Moderate Buy, 4 Hold, 1 Moderate Sell

CommSec’s last call was as a Strong Buy back on 04 Jan 2021 – predicatbly the NCM SP then dropped from $28.14 to $23.60 on 05 Mar 2021.
1640918821896.png


This 2nd snapshot is of the ST Indicators I use that show almost the exact opposite TA.

The CCI, after the recent SHH (pages 108 & 109), and the Rising MFI (page 95) suggest a continued uptrend, totally different to the CommSec Stochastics warning of caution.

The recent Gap up (pages 203 to 213) provides both Minor & Major Support levels below the current SP.
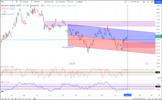
1640918871142.png


The moral of all this is that each Beginner needs to back-test Indicators on their selected Stocks to see how the indicators react to SP fluctuations.

In todays market the Old Brigade of Indicators like CStats, RSI, 200MA, etc, all with their Standard Settings, often give incorrect signals.

Just because a book suggests to you that, for example, O'bought & O'sold lines are set at a particular level, it does not make that suggestion correct or incorrect, it's just a guide, a reference point, a starting point, nothing is 'set in concrete' - look at the Indicator Formulas, understand them, understand what the Indicator uses to calculate it's individual 'End Point' - use that understanding to gain an advantage over other traders....
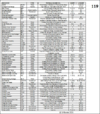
Try different settings to those dictated by the experts (see page 119) - AND look for, and understand how the signals are presented to you (page 118).
As a Beginner you must back-test again, and again, in an attempt to understand the signals that Indicators can give you.

DISC - I Hold NCM - So DYOR

Cheers.
DrB
 
As a follow-up to my last post I would also suggest caution when Researching for Analysist Findings.

You need to know the source of whatever analysis you locate – Then you need to Rate the competency of those analyst’s reports.

For example, in my last post the First Snapshot of the CommSec Summary for NCM, the un-uninitiated would assume that the TA “NCM shares appear etc etc” has been done by CommSec.

WRONG.

The “fine print’ at the bottom of the Summary page reads as follows:-

“The data on this page has been provided by a number of external data vendors and has not been verified by us. All recommendations, data, calculation and values have been provided for your information only and should not be relied on for taxation or any other purposes.

The data has been prepared without taking account of the objectives, financial or taxation situation or needs of any particular individual. Before acting on the information displayed, you should consider its appropriateness to your circumstances and, if necessary, seek appropriate professional advice.

CommSec does not accept any responsibility for any losses suffered due to reliance on the data, calculations or values. Refer to the Best Execution Policy for venues considered by CommSec when executing orders. Recommendations, market prices and other information are supplied by a number of external data vendors. Specific disclosures for each external data vendor can be found here”.


The question you need to ask yourself is –“Based on past performances (as I mention in my previous post above where - CommSec’s last call was as a Strong Buy back on 04 Jan 2021 – predicatbly the NCM SP then dropped from $28.14 to $23.60 on 05 Mar 2021), how much credence do I place on the analysis “NCM shares appear etc etc”?.

Remember we don’t really know who came up with that analysis.

Had a Beginner partially based a decision to buy NCM on or just after 4/1/21 on that CommSec published analysis, they could have lost a large % of their ‘hard earned’.

DISC - I Hold NCM - So DYOR

Cheers.
DrB
 
I find your NCM example very confusing.
First, Commsec does not as a matter of course suggest TA is the basis of their buy/sell recommendations, as they synthesise information (as you note). As a regular reader of Commsec's company reports the information they offer usually contains a future target price and, in the case of NCM, it's not currently within the regression envelope.
Second, Commsec's TA analysis (per your first snapshot) is accurate. If it's not, then say what was wrong with it.
Third, while Commsec made a bad call on 4 January it was based on prices in the $26 range from the previous week due to end-year closures. Using TA in the Xmas/new year period must be about the worst time of the year one could imagine.
Fourth, when the CCI is around 100 (as it presently is), backtesting of NCM's price shows it seldom goes much higher before falling back (on a day basis), but you believe it "suggest(s) a continued uptrend".
Fifth, it is not clear how you use MFI and CCI in tandem as the best buying opportunities in 2021 do not match what you state for the current situation.
Sixth, perhaps you meant you use a 100 day linear regression, as that is what your chart shows. However, neither the 30 nor 100 day regressions have NCM in uptrend, so are you suggesting a counter-trend buy?

As you say, DYOR.
 
Sunday 2/1/22 7.29am

Hi Redrob,

A Happy and prosperous New Year to you too.

Not sure what your problem is M8, but you are obviously not reading my previous posts within this TA Forum.

I’m sorry that you find my NCM post confusing – happy to help you in any way I can.


Firstly – Beginners usually take things “as quoted”, like the Commsec TA I mention above, I was only highlighting the fact that the TA was not initiated by Commsec.

I made no reference to any “buy/sell recommendations”, not sure why you would mention buy/sell.

Second – We obviously have a different reading on that TA, bearing mind the SP drop, that TA was way off target.

Third – thought we had established that it was a 3rd party call, not CommSec, or do you now feel that the garbage TA call was actually commsec’s – hmmmmmmmmmm.

Using TA in the Xmas/new year period works the same as any other time of year- It’s called a Contrarian approach, it just depends on the individuals knowledge of TA.

Fourth – 200 or even 300 are quite often common levels for the CCI.

At 100 the CCI often invokes what is accepted as a “Significantly Higher High”.

Reading pages 108 & 109 may help you.

Fifth -again I suggest you read pages 95, 108 & 109, as well as those, there are other examples within this forum and other ASF forums.

The CCI/MFI tandem approach works well, particularly in 2021 – once you understand how to read the signs.

Six – I always use a 100 day Linear Regression, it does not always need to be in an uptrend, perhaps you should read pages 139 to 142.


Finally, Ahh Ha, a counter trend, now who would think that! – and how would anyone come to a conclusion like that?

Redrob, your attacks are becoming tiresome, if you are going to continue you will need to improve on your 6 point post performance.

I have no intention of explaining everything to you, the information you seek is all within the 3 DrB Forums.

However, here is one of the many tricks to the CCI/MFI combo – the CCI gives the early signal, but to proceed you need a confirming signal from the MFI.


Always happy to accept criticism from people that know what they are talking about, unfortunately you have a lot to learn.

DrB
 
most information about companies on my two trading platforms is supplied by third parties , and therefore delayed ( and i am NOT talking twenty minutes ) , the buy/sell ( and valuations ) should be taken with some extra salt , and you should AT LEAST check the recent announcements ( last 3 months ) for recent activity that might change 'valuations '

at best i would simply class them as guidance , even though the analyst at the TIME they were done , probably put in a lot of effort , and posted the outcomes to the paying clients , quickly .

what might interest novices is to check back on the price action and see if those recommendations affected the price/volume when they were released to the top customers ( did the 'smart money' see danger or opportunity )

that would give some insight into how much 'big money' in sloshing around in the targeted share

being stale doesn't make it useless , but as long as you realize it is yesterday's news , you can judge if the 'smart money' let one fall through the cracks , or milked it for all they could ( for example was it pumped before a cap. raise )
 
Top