DrBourse
If you don't Ask, You don't Get.
- Joined
- 14 January 2010
- Posts
- 892
- Reactions
- 2,118
Another area that Beginners should take note of is the Colour of each individual Candle.
Beginners need to find out why different providers show different coloured candles that are based on the same data.
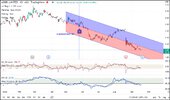
The 2 snapshots below are of FMG 15/9/20 to 19/11/20 incl.
This Snapshot is from Trading View Charts.
It shows 28 RED Candles & 20 GREEN Candles.
View attachment 135599
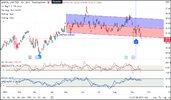
This next Snapshot is from Commsec Charts.
It shows 25 RED Candles & 22 GREEN Candles, and just as importantly Commsec show no Candle for 16/11/20 (the 4th Candle from the right).
View attachment 135600
The problem only arises, IF, you are using Candlesticks as part of your TA.
You might think the Commsec Right Hand Side Candle adds weight to your TA.
However
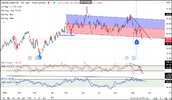
Looking at the Trading View Right Hand Side Candle, note that it gives the exact opposite signal.
Now I realise that the Candle in question is not an Earth-Shattering Signal, but sometimes they are.
I repeat - Beginners Should Question Everything.
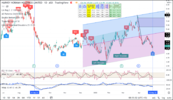
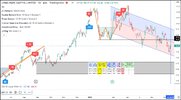
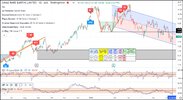
Another example of the above problem.
The 2 charts below are of the the same stock - The stock name is irrelevant.
This 1st chart of from Commsec today at about 10.50am.
Take Note the last 2 Red Candles.
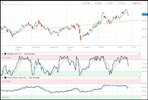
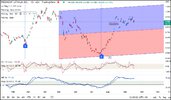
This 2nd chart of from Trading View today, also at about 10.50am.
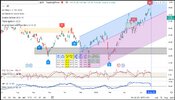
The last 2 Commsec's chart candlesticks suggest caution.
BUT Trading Views last 2 candlesticks are much more positive.
Beginners need to find out why different providers show different coloured candles that are based on the same data.
Cheers.
DrB

