Australian (ASX) Stock Market Forum

DrBourse TA Help for Beginners

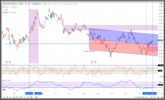
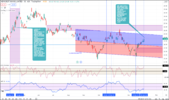
And here is another clue, look at what happened to the SP when the CCI gave its Entry Signal on 1/4/21, the CCI went on to a High of abt 186, (that's way above Rederobs CCI Min/Max 100) it then stayed high while the MFI rose to abt 66 then gave its first sell signal on 23/4/21.
Also note that the CCI on NCM hit well above approx 150 on abt 14 times in the last 12 mths (sorry to blow away your CCI 100 limit theory Rederob)

That’s a pretty reasonable trade IMO, that’s what can happen with the CCI SHH, it gets to that SHH then Stays Reasonably High, during that period is when the MFI comes into play.
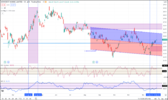
1641085870188.png

Now have another look at the NCM Chart from 15/12/21 to 31/12/21, what do you all think NCM’s SP will do over the next week or so.

Now don’t you wish you had bought into NCM on say 17/12/21, in case you missed it Rederob that's getting pretty close to your Xmas New Year Danger Zone..

How are you doing Rederob, still with me, Huh.

Asking polite questions will get you a lot further than dropping snide remarks – perhaps you should try it sometime.

I just might drop another dozen or so clues into the workings of the CCI/MFI/LR/Gaps game, who knows.

Get off your butts and dig into TA yourselves, I will occasionally provide the entry level clues just to get you all started.

BUT, I will only post within the DrB Forums from here on, too many complaints abt me jamming up 'strictly Financially Based Forums', that way I won't ruffle too many precious feathers.

Cheers.

DrB
 
now early on in my investing adventure ( say 2011 to 2015 ) NCM was seen by some as a proxy for the gold price , is that still the case

some novices might be lulled into thinking NCM rises and falls mostly on company performance

that trap is not exclusive to NCM , a share like QBE also trades with an element of perceived economic risk

for the coming WEEK i see some pressure for NCM to edge higher , but suspect a mid term trend to ease lower ( over the next two months )

but take care

NCM has been known to 'brief financiers ' before
 
Interesting Dr B. I'm no fan of indicators as you probably know - I feel they just complicate further an already complex pastime. However, I've never looked at MFI and CCI together and it does seem to have something going for it. One of the problems with charting (and indicators) is that when you look at past movements you can often have your opinion influenced by peripherally being able to see where price subsequently went. The software I use (Optuma) enables you to pick a date and then it hides future data (so nothing to lead you) and you can then step the chart and indicators forward a day, week or month at a time to see how your prediction turns out.
I don't think I would ever rely solely on indicators (neither would you I suspect) but in conjunction with the tried and true pattern reading (broken trends, price channels etc) this MFI/CCI combination could be something I'll watch.
All the best for 2022 by the way!
 
Hi GN,

Happy & Prosperous New year to you & yours.

As a Technimental Trader I Prefer to Trade Financially Sound Stocks, that immediately reduces any Risk, Pullbacks will still happen, but if the FA is sound then the stock should recover. My Stock Selection is based on 60% Financial Analysis and 40% Technical Analysis - If a stock does not meet my FA criteria, then I do not bother with its TA (so PD’s are never on my Hit List) - Once I locate a Financially Sound Stock, I then proceed to look at its TA.
Even after the 60%/40% exercise, the CCI/MFI/LR process is still just a Minor part of the overall selection process, then I move on to the tried and true pattern reading (broken trends, price channels, candlesticks, gaps, triangles, etc)

The CCI/MFI combo seems to interest a lot of punters for some reason, but as mentioned above, nobody should rely on any One type of TA.

Yeah that 'Stepping the Chart' thing can be done with most Software Packages, just pick a stock, take the chart backwards 2 or 3 years, then work off the Right Hand Side of the Chart one forward click at a time (Dly, Wkly, Mthly or whatever), when doing that, waching the indicator 'end points' is interesting and mesmorising, I find thats the best way to 'Paper Trade' the CCI/MFI game.

So yes, as usual, we agree, relying on TA, or FA alone is a recipe for disaster, punters must learn to get their hands on all available info then they have to learn to 'Sift out the garbage', by using the widely used "Garbage Filter", it's usually located somewhere near the standard "Sheep Indicator" on all Software Progs.

Cheers M8
DrB
 
Last edited:
Not sure what your problem is M8, but you are obviously not reading my previous posts within this TA Forum.
I commented because you presented no evidence Commsec used TA a for either their "moderate Buy" Consensus of 29 Dec 2021 or their Strong Buy back on 04 Jan 2021.
Given your thread is supposed to offer TA help, if you do not analyse the basis of Commsec's recommendations then readers have no idea what Commsec got wrong.
I made no reference to any “buy/sell recommendations”, not sure why you would mention buy/sell.
How can that be so when you said this:
CommSec’s last call was as a Strong Buy back on 04 Jan 2021

Using TA in the Xmas/new year period works the same as any other time of year- It’s called a Contrarian approach, it just depends on the individuals knowledge of TA.
I call that BS. The whole point of TA is use indicators that work. A contrary approach implies a deliberate breach of the reason for using TA in the first place. Contrarian approaches have meaning in Fundamental Analysis because while one might be betting against a trend, the bet is instead on cycle repeating or an emerging trend unfolding.
Fourth – 200 or even 300 are quite often common levels for the CCI.
If that were the case it would show in your posted chart for NCM. 200 was breached only once in 2021 and the last time 300 was breached was in 2003.
At 100 the CCI often invokes what is accepted as a “Significantly Higher High”.
Not according to any backtest of NCM's chart which shows declines are as likely as continuations.
The CCI/MFI tandem approach works well, particularly in 2021 – once you understand how to read the signs.
Technical indicators should be clear and you should have explained what signs you used rather than try to bury your answer in some mystery.
Six – I always use a 100 day Linear Regression, it does not always need to be in an uptrend, perhaps you should read pages 139 to 142.
I used what you stated, which is clearly different, viz:
I rely heavily on a 3 indicators combination, a CCI (10) and an MFI (30) below the chart, and a 30 day Linear Regression on the chart.

Redrob, your attacks are becoming tiresome, if you are going to continue you will need to improve on your 6 point post performance.
You thread is supposed to offer help, yet all I have seen are contradictions and obfuscations.
Always happy to accept criticism from people that know what they are talking about, unfortunately you have a lot to learn.
Just do what you say you intend to, and try to address legitimate questions. You continue to do yourself a disservice by your condescending attitude to posters who query you.

I won't comment on your later post as I backtested what you were trying to show and it made your claims look more like cherrypicking than TA.
 
In the markets there is no such thing as black and white, everything is grey, it's our job to determine if each thing is a lighter shade or darker shade of grey. When someone implies black or white in the they express themselves it leads to misunderstandings.
 
My Stock Selection is based on 60% Financial Analysis and 40% Technical Analysis - If a stock does not meet my FA criteria, then I do not bother with its TA (so PD’s are never on my Hit List)
I agree overall with this concept generally, however I sometimes skip over the FA, as a quick run with the herd can be fun and profitable.
Thanks for your efforts Dr B. ?
 
And here is another clue, look at what happened to the SP when the CCI gave its Entry Signal on 1/4/21, the CCI went on to a High of abt 186, (that's way above Rederobs CCI Min/Max 100) it then stayed high while the MFI rose to abt 66 then gave its first sell signal on 23/4/21.
Also note that the CCI on NCM hit well above approx 150 on abt 14 times in the last 12 mths (sorry to blow away your CCI 100 limit theory Rederob)

That’s a pretty reasonable trade IMO, that’s what can happen with the CCI SHH, it gets to that SHH then Stays Reasonably High, during that period is when the MFI comes into play.

View attachment 135084

Now have another look at the NCM Chart from 15/12/21 to 31/12/21, what do you all think NCM’s SP will do over the next week or so.

Now don’t you wish you had bought into NCM on say 17/12/21, in case you missed it Rederob that's getting pretty close to your Xmas New Year Danger Zone..

How are you doing Rederob, still with me, Huh.

Asking polite questions will get you a lot further than dropping snide remarks – perhaps you should try it sometime.

I just might drop another dozen or so clues into the workings of the CCI/MFI/LR/Gaps game, who knows.

Get off your butts and dig into TA yourselves, I will occasionally provide the entry level clues just to get you all started.

BUT, I will only post within the DrB Forums from here on, too many complaints abt me jamming up 'strictly Financially Based Forums', that way I won't ruffle too many precious feathers.

Cheers.

DrB
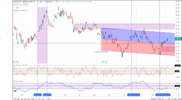
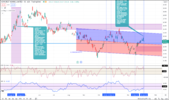
For anyone that’s interested, listed below is a copy of my NCM Chart from the post dated 31/12/21
1641354468530.png
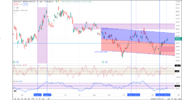
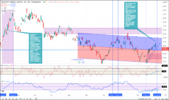
The CCI SHH (pages 108 & 109) is still in play as shown in the NCM Chart today 5/1/22 below.
1641354492695.png
The CCI remains High & the MFI is still rising from a relatively Low position, so the trade is still running…..AND, as you can see the CCI DOES OFTEN Remain High after reaching that SHH while the MFI continues to rise, as shown in the 2 examples in the NCM Charts 1/4/21 to 23/4/21, AND within that NASTY Xmas/New Year Period 15/12 to 5/1/22 that some posters avoid.

Xmas/New Year Gremlins are a figment of the imagination.


The 1st Exit Signal will come from the CCI, BUT we need to wait for the MFI to confirm that Exit – similar to the signals given back 18/10/21 & 27/10/21.

I will hold NCM until I see the appropriate Exit Signals, and even then, I may continue to hold, as there is other TA that suggest a “longer term” hold - however, I have my Sell ready to process just in case one of those Xmas Gremlins lob.

Will post again as the situation evolves.

MY ANALYSIS IS NEVER AN EXCUSE TO ENTER A TRADE - REMEMBER TO DYOR

Cheers.
DrB
 

Attachments

  • 1641354345265.png
    1641354345265.png
    262.4 KB · Views: 5
  • 1641354393736.png
    1641354393736.png
    262.4 KB · Views: 7
For anyone that’s interested, listed below is a copy of my NCM Chart from the post dated 31/12/21
View attachment 135261
The CCI SHH (pages 108 & 109) is still in play as shown in the NCM Chart today 5/1/22 below.
View attachment 135262
The CCI remains High & the MFI is still rising from a relatively Low position, so the trade is still running…..AND, as you can see the CCI DOES OFTEN Remain High after reaching that SHH while the MFI continues to rise, as shown in the 2 examples in the NCM Charts 1/4/21 to 23/4/21, AND within that NASTY Xmas/New Year Period 15/12 to 5/1/22 that some posters avoid.

Xmas/New Year Gremlins are a figment of the imagination.


The 1st Exit Signal will come from the CCI, BUT we need to wait for the MFI to confirm that Exit – similar to the signals given back 18/10/21 & 27/10/21.

I will hold NCM until I see the appropriate Exit Signals, and even then, I may continue to hold, as there is other TA that suggest a “longer term” hold - however, I have my Sell ready to process just in case one of those Xmas Gremlins lob.

Will post again as the situation evolves.

MY ANALYSIS IS NEVER AN EXCUSE TO ENTER A TRADE - REMEMBER TO DYOR

Cheers.
DrB
I note you ignored the points I raised. How does that sit with your apparent desire to "help" others?

If you wanted to post about NCM there is a thread for that.

From the above it appears you have no actual rules for trading as you are happy to ignore the settings you outline. If there is a reason for that, how is is consistent with using technical analysis?
 
Numerous posters follow my posts as I explain to them what I look for in TA, My posts are about my Trading Rules.

Nope, No thread for NCM TA - I tried to post TA into the FMG, CSL & MND Financial Only Forums, too many complaints abt TA invading the established FA threads, so posting here avoids upsetting ppl.

Beginners are not so much concerned about what stock code I am using, it's about them understanding my use of TA.

Really beginning to tire of these useless discussions with you rederob - don't wanna play anymore.
 
Remember - the CCI gives the Signal & the MFI gives the Confirmation.

That Rule works for Entry & Exit.

If the MFI gives an Entry or Exit Signal B4 the CCI, I consider that MFI Signal to be a "Warning to Watch, while having my finger on the SELL Button".

With this System of CCI + MFI I never expect to "Enter at the Low Point, or to Exit at the High Point", as I always need the 1st Signal 2B Comfirmed, and that is usually 1 or 2 days after the Low Point, and 1 or 3 days after the High Point, it's just a Safety Mechanism that suits me.

With todays examples, with the CCI having already given it's Signal, I am now, also watching the Candle Formation (pages 3 & 5).

A High Risk Trade would be to just trade withe the CCI, plus the other standard TA Tools - Bit too risky for my style.
 
Last edited:
Hi GN,
My settings of 10 & 30 work reliably on any Chart, be it Tick, Minute, Dly, Wkly, Mthly or Yearly.
It just takes a bit of time to understand the Signals.

Using a Tick Cht, for example, the signals are changing with every Tick, so if you want to act on those signals you need to be VERY VERY QUICK, & the Signals from the Tick & Minute Charts tend to be a bit "Whippy".
Using a Minute Cht, for example, the signals are changing every Minute, so if you want to act on those signals you need to be VERY Quick.
Using a Dly, Wkly, Mthly or Yearly Cht, for example, the signals and Candlesticks are changing at a reasonable speed that is easier to understand, so if you want to act on those signals you don't need to rush any decisions, aLSO, the Signals from the Tick & Minute Charts tend to be a bit "Whippy", It's probably just my age M8, can't handle anything too fast these days, I would prob Trip over the rapid fire signals!

Tick Trading is way too fast for most people, tried it a long time ago, settled on the Daily Charts for Indicators & Candlesticks - although OCCASIONALLY I will swithc over to a "3 Day Minute Chart", that will give me a look into the "Candlestick Addition & Construction" (pages 3 & 4).
 
GN, many years ago I met a "Husband & Wife team" that tick traded, they each had a Computer with 3 VDU's each, they were quite successful, One would Buy, the other would be responsible for the Sell, they switched the workload on a regular basis, weekly from memory, lost track of them over the years.
 
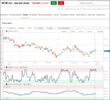
sometimes, when sitting and waiting for the Confirming MFI Signal I will switch to dear-ole' Commsuc Charts and have a look at the "WILL%R and MFI" indicator combinations, just to see where those Indicators 'End Points' are in relation to The Trading Views "CCI & MFI" Indicators, occasionally the WILL%R will move a bit quicker, not often, only very occasionally.
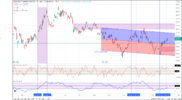
Nothing much happening with either the CCI, MFI or the WILL%R.
1641440114812.png

1641441399092.png
 
Last edited:
Numerous posters follow my posts as I explain to them what I look for in TA, My posts are about my Trading Rules.
I showed a number of your contradictions and that you chose to break your rules without explanation. I am trying to discover your rationale, but you get exceptionally defensive and choose to deride me, which is not especially helpful in anyone's book.
Nope, No thread for NCM TA - I tried to post TA into the FMG, CSL & MND Financial Only Forums, too many complaints abt TA invading the established FA threads, so posting here avoids upsetting ppl.
Well this is ASF and nobody cares if its TA or FA in the stock thread because that's exactly why they exist.
Beginners are not so much concerned about what stock code I am using, it's about them understanding my use of TA.
I get that.
At no time did you explain the purpose of TA, or am I mistaken, given you appear to think it also allows contrarian actions?
Really beginning to tire of these useless discussions with you rederob - don't wanna play anymore.
It's useless to you, but I am trying to understand how you think you can help beginners when you avoid responding to the points I made.
You keep using NCM as an example but never showed the original technical analysis from Commsec, so there is no basis for what you are doing except to explain your own "system." Again, set up a thread for that, as many others at ASF have done.

What in your opinion was the technical analysis that Commsec got wrong? Their later report suggested caution so what do you offer that suggests their call was a poor one?
 
Last edited:
Top