Australian (ASX) Stock Market Forum

While the US keeps printing money, I wouldn't be surprised.

But, we can only kick the can down the road for so long...
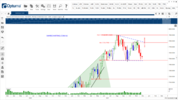
Its been an interesting conversation @Sean K and @Ann - thanks, I do read, but don't often say too much when it comes to charts and predicting. The continuation up to 9900 would certainly put all those retirement nest eggs in great shape.

However, you're right @Sean K about only being able to kick the can down the road for so long, but my job as a system follower is try to put those things out of my head. Just follow the system, and let the system tell me when the can needs to be kicked down a different path.

I think the Friday and Friday night sessions were two cases of the can starting to object to all that kicking.

KH
 
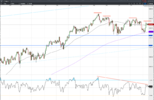
XAO sitting on some horizontal and 200dma support across 7500 ish. All things being equal this should see a bounce here but I'm hoping we end up on the longer term blue line horizontal support just above the 50% mark of the 10 year channel around 7200.

Screen Shot 2021-12-02 at 11.25.53 am.png


Screen Shot 2021-12-02 at 11.33.24 am.png
 
You can see my thoughts on the XAO in my weekly blog thread but I noticed today there appears to be a flag pattern developing (the blue dashed lines mark the boundary). The pattern on the weekly chart has 2 peaks and 2 troughs (well 3 actually) on those upper and lower boundaries which is the technical requirement. I'd suspect prices will move up from present levels and hopefully break the overhead boundary at its third attempt (and third attempts often succeed). I've got a range of targets (8200, 8340 & 8500) - Anyway, despite all the negativity at the moment, as long as price doesn't break down out of the pattern I'd say brighter days are on the horizon. Price could bounce down off that upper boundary one more time but charting theory suggests flag patterns after an uptrend break up more often than down.
1638822695159.png
 
You can see my thoughts on the XAO in my weekly blog thread but I noticed today there appears to be a flag pattern developing (the blue dashed lines mark the boundary). The pattern on the weekly chart has 2 peaks and 2 troughs (well 3 actually) on those upper and lower boundaries which is the technical requirement. I'd suspect prices will move up from present levels and hopefully break the overhead boundary at its third attempt (and third attempts often succeed). I've got a range of targets (8200, 8340 & 8500) - Anyway, despite all the negativity at the moment, as long as price doesn't break down out of the pattern I'd say brighter days are on the horizon. Price could bounce down off that upper boundary one more time but charting theory suggests flag patterns after an uptrend break up more often than down.

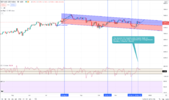
Would be good if that 7450 ish support line holds for another leg up, but I'm leaning to the downside, even with a supposed Santa Rally in the winds. I'm swayed by the lower highs. However, the long tails on many of the candles along the support line indicate good buying on weakness. So, sideways for me until 7800 or 7450 broken for up or down bias.
Screen Shot 2021-12-14 at 10.24.17 am.png
 
Would be good if that 7450 ish support line holds for another leg up, but I'm leaning to the downside, even with a supposed Santa Rally in the winds. I'm swayed by the lower highs. However, the long tails on many of the candles along the support line indicate good buying on weakness. So, sideways for me until 7800 or 7450 broken for up or down bias.
well bank dividends start hitting the accounts this week MQG lands today

what i have noted in the preceding week ( including yesterday ) a decreasing number of shares turned over daily

so a little 'spare cash ' and reduced turnover MIGHT make percentages look more dramatic

now MAYBE this year the smaller caps. will get a more favourable attention ( that would be a bummer for me , i love 'dumpster-diving for small and micro-caps )
 
My thoughts on the XJO between now & Xmas Eve.

The CCI gave us the Reversal Signal on 29/11, a bit early but still a very good signal, as I prefer to know few days B4 Reversals actually happen.

IMO this current ST Uptrend should “run out of steam”, on or B4 24/12/21.

The Current CCI Significantly Higher High (Suggested Downtrend) on 9/12/21 is a Very Weak Signal IMO, similar signals were given back on 3/8/21 & 18/10/21, note that the SP kept rising for a week or so after those dates, I expect this time will be similar (pages 109 & 109).

IMO the XJO should be @ abt 7460 by COB 24/24/21.

1639450495784.png

Remember to DYOR.

Cheers.
DrB
 
Ann, can you do that on a logarithmic scale? Probably has the same support line but will flatten.

Ideal case for me, where I'll feel more confident in deploying cash, is if we hit the green circle.

View attachment 133506
Hi Sean K,

Thought I would add some food for thought, particularly for the Beginners in this Profession.

The following is just a copy of a post I've been using for years.

"People should experiment with all 3 Chart Types (Linear, Log & Arithmetic)…Each Chart Type produces slightly different outcomes when conducting Chart Analysis - I find it amazing, to say the least, that some people persist in using Indicators with Linear & Log Charts, because Indicators are an "Arithmetic Calculation" based on individual and complex Mathematical Formulas…I would suggest that anyone using the Linear & Log Type Charts should make allowances for the conflict of interest between the different results…. I rely very heavily on Indicators, so I naturally use an Arithmetic Chart with Arithmetic Calculation Indicators for all my analysis…I have seen many incorrect decisions derived from using Log or Linear Charts in conjunction with Arithmetic Indicators….If and when the Mathematicians of this world come up with Linear and/or Log based Indicators then we would be able to match "Linear Charts with Linear Indicators, Log Charts with Log Indicators.

Cheers.
DrB.
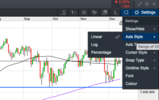

Thanks DrB. I don't have that as an option on my charting. Unless % is the same as Arithmetic?

Screen Shot 2021-12-14 at 2.12.22 pm.png
 
NP Sean, IMO Linear is the clostest to Arithemtic.
Maybe there are some Mathematical Whizzs in here that could help clarify the options.
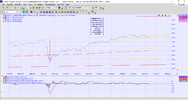
I generally go back and forward from Log to Linear with the same TA attached to see if there's any major discrepancies. I'll switch to the % one now as well to see what happens.
 
@Sean K I have been using IC charts https://www.incrediblecharts.com/ for about 20 years. They are really good in so many ways. One of the great things is you can chart ahead with trendlines for many years beyond today's date. It is also a great way to tuck info away if you want to do a chart display and not have sht all over the place. However, the downside is it can be lost for eons. I tack up words of wisdom all over the place and come across them eventually with great pleasure. I only ever copy words of wisdom from the very best sources but stupidly I normally never say where I got it or who said it. I trust what is there.

Tonight I accidentally looked at the monthly $XAO and tucked in a corner of 2025 was a very interesting "rule". I had pondered on it years ago but shrugged my shoulders as it never really made sense....until now.

The words were "Using MACD + 100mma don't buy crossover unless under 100mma don't sell on crossover unless above 100mma"

I have put up a chart showing the last major market fall with the 100smma in purple. Now, look at the MACD. This may be very interesting if we have a market melt-up. A good indicator of when to F-off, don't you reckon?
This quote has been a quandary for me for many years as the MACD is constantly criss-crossing but I think I see it now, are you seeing what I am seeing?


$XAO 14.12.21 100mma macd cross.png
 
The horizontal support around 7450 and 200d ma has proven to be a block to the downside. Now hitting the 7800 ish resistance line. If it breaks through in the next few days it could represent a higher high and defeat any downward bias.


Screen Shot 2021-12-29 at 10.21.32 am.png
 
The XAO is very close to what I have seen for some time as its upper target. Could it be this is like a skyrocket that streaks ever higher only to explode at its zenith?
Not feeling very comfortable!
Maybe someone has hacked the Big End of Town while they are off celebrating the silly season and slipped in a bit of code that says buy, buy buy.......
 
Top