Australian (ASX) Stock Market Forum

No it's not but where the S&P500 goes we lag but follow.
The potential breakout of the above is potentially a positive guide of where we (and the rest of the world) may be headed, imo of course :cautious:.

https://www.aussiestockforums.com/posts/1071246/
I get the idea, but last night's action was predicated on Moderna's announcement, and our Allords has no exposure.
Here's the past year's comparison between the DJI and XAO which shows the obvious correlation:
c2aMqj6N.png
I don't do technical analysis, but I know the above pattern had no meaningful advance warning of the COV19-inspired selldown.
I also suspect that much of COV19's worst effects on Oz markets are behind us, so the XAO should do ok from here.
I am not sure the US economy is where we are at in terms of recovery, but maybe to Trump's America "a small percentage" dying from COV19 is neither here nor there.
 
Possible turning point?

Almost touched the 6000 resistance on the XJO with high volume the last three days, Wednesday & Thursday weak closes while advancing then the big dump today on ultra high volume

Thoughts?

XJO 2.PNG
 
Have been meaning to post this for a while, the XAO has found resistance at the 61% fib retracement area but has maintained its upward trend as it has a second go at moving higher.
With volume trending down a little and daily range falling possibly indicates that a break through higher is possible.

I also wont be surprise if we move side ways from here.


XAO 7.png
 
I also wont be surprise if we move side ways from here.
I find it hard to believe that the XAO is going to tippy-toe sideways through September and October but that is what the chart is suggesting. Either that or we keep drifting up. The S&P500 is already back to its high but the XAO is weighed down by the banks.

Of course November is the US election so it's all bets off after Tuesday 3rd November.

upload_2020-8-18_0-58-38.png
 
Things will improve from here. Victoria's turned the corner and we're heading into summer.
 
XAO trying to push up into prior overhead resistance out an ascending triangle here. Watch for some consolidation and for weekly closing prices to hold inside the 6310 - 6490 zone.

$XAO.JPG
 
Yeah, it certainly isn't where the action has been. Instruments like leveraged sector etf's etc are also rather limited.

There are plenty of sectors that have done quite well, though obviously offset by those which haven't.
 
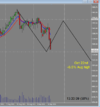
I have prepared two directional Roadmaps that the XAO may follow . The first Curve outlined on the chart indicates that trend may continue down into either Friday 1st or Monday 4th October where a decline of 6 1/2 % is indicated from the 13th August Top at 7902 . Currently we are down around 4 1/4 % so this may be a handy measure if trend continues down into the Forecast date . From this point trend is projected up till the 22nd October Top then down into the 11th November Low . Past Cycles point towards a rise of 8 1/4 % into the October Top but at this point it is just a technical measure and not a definitive projection .

The second Curve outlined on the Chart points towards the same Low occurring 1st or 4th October with the first swing up till the 14th October then down into the 22nd October then up to Main Top on the 11th November .
October 22nd could set up as a significant date as it is 120 Deg in time from the 21st June Low making it an important time period for change in trend and it is also a Seasonal Date at 210 Deg on The Square so I will be watching the pattern and formation of trend moving into these dates .

November 11th is 90 Deg in time from the 13th August Top and 180 Deg out from the 11th May Top so with the convergence of these two intermediate Cycles it could point towards a significant turning point but at this point it is difficult to quantify it as high or low but as we move into these dates the pattern of trend should provide us with a clear indication as to whether we are setting up as high or low and then once that date has been confirmed on the next one or two price bars I will look to enter in the prevailing direction of the roadmap and trade that swing out till the next date with a time stop in place . Watch 7550 * it is a full square in price .
 

Attachments

  • xao.jpg
    xao.jpg
    195.1 KB · Views: 52
The two Curves presented are based upon repeating Cycles so there are two projections that we may be running against . As we approach these dates we should have a clearer indication on pattern of trend .

Just had a look at the SP500 and there are two dates of interest where Low could occur. The first Cycle date comes in on the 21st September so if we drop into this date the two main price points I will be watching are 4417 and 4410 with a secondary target at 4392 . If Low is confirmed on those points I will position long and draw up a roadmap out till the end of October.
 
I have prepared two directional Roadmaps that the XAO may follow . The first Curve outlined on the chart indicates that trend may continue down into either Friday 1st or Monday 4th October where a decline of 6 1/2 % is indicated from the 13th August Top at 7902 . Currently we are down around 4 1/4 % so this may be a handy measure if trend continues down into the Forecast date . From this point trend is projected up till the 22nd October Top then down into the 11th November Low . Past Cycles point towards a rise of 8 1/4 % into the October Top but at this point it is just a technical measure and not a definitive projection .

The second Curve outlined on the Chart points towards the same Low occurring 1st or 4th October with the first swing up till the 14th October then down into the 22nd October then up to Main Top on the 11th November .
October 22nd could set up as a significant date as it is 120 Deg in time from the 21st June Low making it an important time period for change in trend and it is also a Seasonal Date at 210 Deg on The Square so I will be watching the pattern and formation of trend moving into these dates .

November 11th is 90 Deg in time from the 13th August Top and 180 Deg out from the 11th May Top so with the convergence of these two intermediate Cycles it could point towards a significant turning point but at this point it is difficult to quantify it as high or low but as we move into these dates the pattern of trend should provide us with a clear indication as to whether we are setting up as high or low and then once that date has been confirmed on the next one or two price bars I will look to enter in the prevailing direction of the roadmap and trade that swing out till the next date with a time stop in place . Watch 7550 * it is a full square in price .
I’m a great fan of Gann and use his teachings mixed in with a range of other theories.

Predicting actual dates for lows and highs is always a risky undertaking as I’ve found charting to be great at picking the general movement of a stocks price and likely lows and highs, but not good on time. Time theory is so subjective I rarely use it but seeing your post I thought I’d dust of the memory cells and see what it suggested about the XAO.

I found 60 day cycles were a fairly good fit with recent troughs (see vertical lines on chart). Also seemed a good match for highs and suggested a low today (21st) and the next peak on 16 October.

I said some months ago the XAO would get to around 7500 – 7700 and then in August firmed that up to 7900 – 8000. In my view the market has probably topped out and we could be falling into the ‘correction we had to have’.

I’ve got low target of 7480 pegged for the current fall. However, that is an interim target and if price doesn’t turn around there and move up again to around 7750 where a possible new downtrend is forming and likely to turn price again, then 7364 is the next stop on the way down. 7364 is only a 7% fall from the recent peak and not enough to be a formal correction. I see a 12% fall to 6900 a more likely drop if the wheels fall off.

Yesterday the XAO closed at or near support and we’ll just need to see what today brings (I’m thinking perhaps lower on open from the lemmings heading for the door and then a recovery later in the day.

I’d like to think there is one more push to around 8000 left in fuel cells but the potential to correct is worrying. Interestingly, I noticed yesterday’s volume was less than half of last Friday’s so perhaps there is some hope that the rush to sell is slowing.
 

Attachments

  • 1632177782824.png
    1632177782824.png
    418 KB · Views: 36
Thanks I will come back to the XAO later when time permits , but having a look at the SP500 the target date for Low is still in play 21st September and there are two price points of interest 4271 * which is about 34 points under last nights low and this looks to be a strong mathematical point so I have noted it down as reference and then above that the second weaker target is 4290 so we will just have to watch the price action around these zones to see if the SP500 is setting up for Low tonight .
In regards to your counts these appear to be fixed cycle lengths which can sometimes point towards important turning points especially if there are several Cycles of differing magnitudes converging towards a central point but as a whole the market does not always conform to these static lengths as there may be other harmonic factors or Cycles controlling the trend .
 
There is also another Cycle I may have overlooked so after todays strong move down I have constructed another Curve on the basis that the 21st September holds and turns out to be Low . If we are following this model we may be up till the 29th September for Minor Top then down into 4th October for Minor Low then up till 8th November where Main Top is indicated which was outlined on the previous model so as we approach these dates the direction of the trend leading into these points should provide us with a clearer indiaction as to whether we can expect top or bottoms around these time periods .
 

Attachments

  • xaoadj.jpg
    xaoadj.jpg
    119.6 KB · Views: 19
Top