Australian (ASX) Stock Market Forum

Strategy for trading the ASX 200 daily

Joined
22 June 2006
Posts
198
Reactions
0
hi all

can anyone provide some insight into your trading strategy in trading the asx200 index,

i'm currently using CFDs and with the current rally on the market ive basically lost most of my profits i built up over the last couple of months,

im going short the asx200 and would like to know what strategy you employ in trading the asx200,

i use the 30 min chart to reduce noise and misleading indicator signals but i have had very limited success,

what techniques do you use?
 
Re: Strategy for trading the ASX200 daily

I use trend lines , symetrical triangles and all that jazz but most importantly I do this on the s&P 500 aswell. If the s&P500 is looking really bullish then I'd hold back on going short on the asx200. I dont trade it a lot but that would be a little rule of thumb of mine
 
Re: Strategy for trading the ASX200 daily

Here is a strategy. Learn about Max risk per trade!!

Another place to start would be learn about Support....
 

Attachments

  • SPI March 09.gif
    SPI March 09.gif
    16.9 KB · Views: 41
Re: Strategy for trading the ASX200 daily

CFD on the DOW I have found out you need to go with the trend not fight it.
Watch it for awhile and see if you can judge the direction....It can suddenly turn and burn you out which is a pain because you need to watch it all the time.
Still to make any serious money.....only thing is it should be a bear in this market GFT send out reports as they happen and you can try and judge the trend...bit hard when some CEO sends out a memo and the World market lights up.
 
Re: Strategy for trading the ASX200 daily

hi all

can anyone provide some insight into your trading strategy in trading the asx200 index,

i'm currently using CFDs and with the current rally on the market ive basically lost most of my profits i built up over the last couple of months,

im going short the asx200 and would like to know what strategy you employ in trading the asx200,

i use the 30 min chart to reduce noise and misleading indicator signals but i have had very limited success,

what techniques do you use?
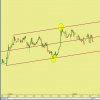

here's a tool worth considering.
its little known and little used (which is a good thing!). and theres a little magic in it.

its called "andrews pitch-fork"

when price approaches the outer lines, there is a good place to consider a trade

below is a picture of the SPI yesterday and today
 

Attachments

  • APF.jpg
    APF.jpg
    26.6 KB · Views: 320
Re: Strategy for trading the ASX200 daily

James, I have look at the Andrew's Pitchfork but I am having trouble applying it to a chart. Can you help please?

Cheers
Scotty
 
Re: Strategy for trading the ASX200 daily

My software asks for 2 points of reference. The first is a reference to the center line and the second is for one of the outer channel lines. Where on a chart would you put these 2 points. Can I suggest we look at the daily chart of the XJO an try to use some points of reference there.

What instrument are you actually trading? May be you should look at the chart for the actual instrument, or is there a particular reason that you are looking at the XJO?

How do I take 80 tics a day? :p:

By far the easiest way is to set up yourself as a Market Marker CFD provider and target your marketing towards small investors, while kick out anyone who show consistent profit...
 
Re: Strategy for trading the ASX200 daily

My software asks for 2 points of reference. The first is a reference to the center line and the second is for one of the outer channel lines. Where on a chart would you put these 2 points. Can I suggest we look at the daily chart of the XJO an try to use some points of reference there.


Source 3 “obvious” pivots on a chart in your preferred time frame.

You are always looking for the “best-fit” re price trajectory.

Move the APF as price action develops.

Its not difficult with some practice.


View both of these:

http://www.youtube.com/watch?v=VTtqsmCqMhQ

http://www.scribd.com/doc/7056540/Market-Maps-Timothy-Morge


* i cant draw APFs on the XJO cos i dont have the data feeding into my software
 

Attachments

  • ML1.jpg
    ML1.jpg
    28.8 KB · Views: 287
Re: Strategy for trading the ASX200 daily

skc,
I can use any chart. I was just suggesting the XJO so both of us could be looking at the same one. That way I could place the points of reference where James suggested. I can use any chart.
 
Re: Strategy for trading the ASX200 daily

hi Trembling hand,

what time frame do you have on that chart of yours?

its good to see the support and resistance levels on your chart

regards
 
Re: Strategy for trading the ASX200 daily

Thanks James.

Can you please give me the name of a chart and pivot points to use so I can try to apply the APF.
 
Re: Strategy for trading the ASX200 daily

hi Trembling hand,

what time frame do you have on that chart of yours?

its good to see the support and resistance levels on your chart

regards

It doesn't matter what time frame your charts are. That support was on all time frames but that was a hourly of the SPI with SYCOM included.

Not only was that support there it was standing up in the face of the US getting "oversold", plenty of forewarning of a coming rally. You want to learn how to trade.... learn about market movements not breakout/breakdowns they don't pay.

BUT I will say it again just in case it was lost in the banter. To lose 2-3 months of profit on a 1 day rally of some 2% shows that your problem is FAR greater than "trading strategy".
 
Top