DrBourse
If you don't Ask, you don't Get.
- Joined
- 14 January 2010
- Posts
- 891
- Reactions
- 2,112
Another Example for Beginners....
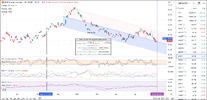
The following Chart of BHP on Last Night’s NYSE…

Note the following…
2/5/24 was a RED Candle, so Sellers were still in Control at the End of The Day…
The CCI 10 BLUE Line has just crossed up through its WMA 10, so that’s My 1st Entry Point,… BUT that needs Confirmation of some sort, A Green Candle would be Great…
The DMI 7 (as per the RULES), shows that the GREEN Line is UP, and the RED Line is DOWN, that combo suggests a ST Uptrend… BUT that needs Confirmation of some sort, The RED Line going DOWN through the BLUE, and the GREEN Line continuing UP would also be Great….
The last Entry is SUGGESTED if/when both the BLUE & GREEN Lines go above the RED Line….
The MFI 30 is just below its Centreline, so it is still just “Under Water”… That needs to cross UP through “to ABOVE it’s Centreline”…
Now, look back to 13/11/23 (the Blue Dotted Vertical Line) – on that day the CCI gave its Entry Signal – the DMI GREEN Line was UP, and the RED Line was DOWN – the next day, 14/11/23 the GREEN & BLUE Lines are above the RED… The MFI was already ABOVE it’s Centreline…
Look at where the SP went after that combination of CCI, DMI & MFI Signals were given.
Admitedly, Those of you with the God Given Ability to correctly call a ST Trend Bottom MAY have been able to enter on 8/11/23 - Personally, I don't like Falling Knives...
Once again - Good Luck with all that - AND REMEMBER that TA is a DAILY Event... So DYOR....
Cheers...
DrB.
The following Chart of BHP on Last Night’s NYSE…
Note the following…
2/5/24 was a RED Candle, so Sellers were still in Control at the End of The Day…
The CCI 10 BLUE Line has just crossed up through its WMA 10, so that’s My 1st Entry Point,… BUT that needs Confirmation of some sort, A Green Candle would be Great…
The DMI 7 (as per the RULES), shows that the GREEN Line is UP, and the RED Line is DOWN, that combo suggests a ST Uptrend… BUT that needs Confirmation of some sort, The RED Line going DOWN through the BLUE, and the GREEN Line continuing UP would also be Great….
The last Entry is SUGGESTED if/when both the BLUE & GREEN Lines go above the RED Line….
The MFI 30 is just below its Centreline, so it is still just “Under Water”… That needs to cross UP through “to ABOVE it’s Centreline”…
Now, look back to 13/11/23 (the Blue Dotted Vertical Line) – on that day the CCI gave its Entry Signal – the DMI GREEN Line was UP, and the RED Line was DOWN – the next day, 14/11/23 the GREEN & BLUE Lines are above the RED… The MFI was already ABOVE it’s Centreline…
Look at where the SP went after that combination of CCI, DMI & MFI Signals were given.
Admitedly, Those of you with the God Given Ability to correctly call a ST Trend Bottom MAY have been able to enter on 8/11/23 - Personally, I don't like Falling Knives...
Once again - Good Luck with all that - AND REMEMBER that TA is a DAILY Event... So DYOR....
Cheers...
DrB.
Attachments
Last edited:


.png")
.png")


.png")
.png")


