DrBourse
If you don't Ask, you don't Get.
- Joined
- 14 January 2010
- Posts
- 891
- Reactions
- 2,112
Overnight CSL's ADR's were up 1.38% & 1.90% respectiely, but watch for the Friday Profit Takers, keep your finger on the trigger....For anyone following this current CSL Scenario, the next thing you would need to look at is your Exit Strategy, namely what date? and @ what price?....
There are enough clues within the following chart to indicate my personal early exit strategy....
View attachment 178251
Cheers..
DrB.


This is a follow-up to my above post #285 on 17/6/24 Re the “DrB 3 Indicators”…..There have been a few people asking for some more information on the indicator’s that I use….
In this post I will try to explain how I read & interpret the 3 indicators I use for my TA, the CCI, DMI & MFI….
To start with, I only look at the TA of Financially Sound Stocks that I have researched, and where I have calculated their Intrinsic Value as I describe in my DrBourse Forums, or where other ASF Members have asked for my thoughts on a particular stock – I will always help others and provide my views when time permits – I will NOT provide Buy or Sell recommendations….
I will use the stock code GMG for this exercise as it relates closely with the excellent work done in the Dump It Here Forum by skate @Skate ….
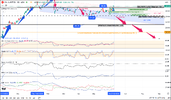
View attachment 178797
Read the following notes in conjunction with the above chart…
====================================================
The CCI is my Early Warning Indicator, it usually gives an entry signal 1-5 days before the DMI or MFI, So I would NEVER act on the CCI without Confirmation Signals from the DMI & MFI in particular, and from my Other Tools of Trade…
Refer to pages 38, 39, 41, 43,108 &109 from my Manual as shown below to see what the CCI signals mean….
View attachment 178798
View attachment 178799
You may notice that I always prefer to use WMA’s on my charts (see page 80), but, occasionally I will look for any differences by switching to a SMA, but only on the CCI itself….
And I NEVER use Smoothing (see page 48)...
So, for GMG the CCI gave an Entry Signal Very Early on 19/1/24, where the actual CCI crossed UP from -130 on 18/1/24, Through its own Centreline & WMA up to a reading of +45 as at COB 19/1/24…
====================================================
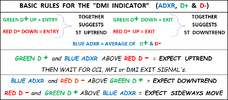
The DMI is one of my confirmation indicators…
Refer to page 105, 106 & 107 from my Manual as shown below to see what the MFI signals mean….
View attachment 178800
However, the DMI still had the Red & Green Lines ABOVE the Blue Line on 19/1/24 - Refer to the diagram below…
View attachment 178802
So, for GMG the DMI gave an Entry Signal Very Early on 24/1/24, where the DMI Blue Line clearly crossed UP to ABOVE the Red Line, and the Green Line had already crossed up to above the Red Line on 22/1/24…
Another Signal provided by the DMI is The Power of the Green Line, it will suggest the Strength of the Uptrend, a Sharp Rise will usually Gap Up, or a Flat/Slow Rise will probably result in a Slow Uptrend….
Another Signal is where when any Line goes to a Significantly Higher High (SHH as explained in the CCI notes above on page 108), although that signal is considered inferior to the CCI SHH…
====================================================
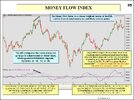
The MFI is the 2nd of my confirmation indicators, refer to page 95 from my Manual as shown below to see what the MFI signals mean….
View attachment 178801
Basically, the MFI is a Centreline Indicator, meaning that any point ABOVE that Centreline suggests that the Money is flowing into the stock in question at an acceptable rate – However, it would be “Of Concern” if the Indicator was BELOW its Centreline….
The MFI is a good Volatility Indicator as well – Any wild swings suggest a Very Volatile Stock – However a Flat Line just above the MFI Centreline would be ideal,
On 19/1/24 the MFI was just below its Centreline @ 47.56….But on 24/1/24 the MFI was just above its Centreline…
So, just a few minutes after the open on 24/1/24 I had all the Entry Parameters that I needed…
=====================================================
There are other Signals given by the 3 Indicators, such as Double Tops & Bottoms, Divergences, Trend Lines, Support & Resistance Lines, etc.
There are also numerous other signals that can be observed on a Chart, such as are the Candlesticks Green or Red, Candlestick Addition, Candlestick Formations, Candlestick Construction, Candlestick Patterns, Candlestick Definitions, Linear Regression Indicator, the 2 Kicking Indicators, The Benchmark Candle Formations, etc, etc…
NOTE – That the triangular “B & S” Icons are placed into position by me using Cut-n-Paste…
All of the Other Signals are explained, in detail, within the Free Manual…
Copies of the Manuals are free to anyone – just contact me via the “ASF Private Conversation” facility…
However, most pages from the Manuals have already been posted within my Beginners Lounge DrB Forums:-
DrBourse General Help for Beginners.
DrBourse TA Help for Beginners.
DrBourse FA Help for Beginners.
Happy to answer any questions….
======================================================
I feel that the Human Brain can obviously be trained to take in all of the above information & parameters, and a lot more, However, a Scanner or a Coded System cannot, it has been tried by many people over past years – AI may be an option, but I know nothing about AI….
Cheers..
DrB.


Today is 19/6/24, 8.50am….For anyone following this current CSL Scenario, the next thing you would need to look at is your Exit Strategy, namely what date? and @ what price?....
There are enough clues within the following chart to indicate my personal early exit strategy....
View attachment 178251
Cheers..
DrB.


Ok Beginners, (and for the many doubters in the background) here is another example of the results you can obtain once you fully understand your chosen Indicators…..For anyone following this current CSL Scenario, the next thing you would need to look at is your Exit Strategy, namely what date? and @ what price?....
There are enough clues within the following chart to indicate my personal early exit strategy....
View attachment 178251
Cheers..
DrB.


@DrBourseToday is Friday 20/10/23 at abt 2.15pm….
Some Weekend Homework for Beginners....
We obviously do not know what will happen on Monday 23/10/23….
But have a look at GUD….. The current SP @ abt $10.80 is BELOW it’s Current IV $12.41...
This is a situation where we need to prepare for and be ready to enter if all goes to plan….
If Monday Mornings Candle is Green, it will, in effect, be a Bounce off the BCF (pages 197 to 199),..
And the DMI should follow the standard DMI Rules (see instructions on the chart & pages 105–107)….
The CCI Indicator has already formed a Double Bottom (pages 20, 82, 96, 97 & 109)….
The DMI Blue Line has already crossed up through the Red D- Line…. (pages 105, 106 & 107)…
So the DMI should produce the Blue Line continuing up, the Red Line Turn Down, and the Green Line turn UP….
Then we would need to watch what happens to the Blue & Green Lines – On the previous trade 13/6/23 to 18/9/23, note where the Blue & Green Lines were from 12/7/23 to 18/9/23 in relation to the actual SP…. That is, while the Blue & Green lines are above the Red Line, we stay in the Trade, even though there were a few Minor Exit Signals...
View attachment 164317
If the above does not go to plan, we revert to Plan B, and look for something else to trade....
Cheers...
DrB...

@Miner ....@DrBourse
Trust you are well.
I was randomly browsing few threads and this one from 2023 attracted my attention.
The GUD price is hoevering around same price range when your post was made.
What is your current view on GUD ?
View attachment 179344
Many thanks Dr B@Miner ....
GUD is obviously in a ST Downtrend atm - The MFI is the only one of my 3 Inds in +ive territory....
No real TA clues on where it will end up atm....
I will wait for the CCI to provide it's Early Warning Signal....
Then I wait for the DMI & MFI to give their Confirmation Signals....
No Dr B. Just learnt from you . ASX quoted as GUD until yesterday but now GUD code has been taken out today.
Ok Beginners, (and for the many doubters in the background) here is another example of the results you can obtain once you fully understand your chosen Indicators…..
Remember that I DO NOT provide Exact Entry/Exit points, or Exact Buy/Sell information….
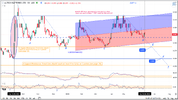
Refer to the Chart Below, posted here on 6/6/24, Post #282, page 15….
View attachment 179326
View attachment 179327
From the Chart Above, you can see my personal entry point was $288.00 on 6/6/24….
That Entry point was dictated by the following TA…
A Containment Candle Formation (page 30) appeared on 30/5/24 & 31/5/24 just below the BCF Top Line (pages 197 -199)….
It was within a clearly defined ST Uptrend, and although that is not a requirement for this type of candle formation, it was still nice to see that….
My personal Entry point could have been a day earlier (5/6/24), but my that was my personal decision…. The ruling fact was that the candles for 3/6/24 & 4/6/24, were both RED, so I needed Green Candle AND a Confirmation Green Candle, that confirmation candle was there on 5/6/24, but, as explained in the 1st line on page 30, that was day 3 of the Confirmation Candles ST Life…. So my entry, as posted late on 6/6/24, was early 6/6/24 @ $288.00….
Then later, on Thursday 6/6/24, I posted the following (Post #282, page 15) – “For anyone following this current CSL Scenario, the next thing you would need to look at is your Exit Strategy, namely what date? and @ what price?....
There are enough clues within the following chart to indicate my personal early exit strategy....”
Then in post #283 (before open) on 7/6/24 I gave a warning – “Overnight CSL's ADR's were up 1.38% & 1.90% respectiely, but watch for the Friday Profit Takers, keep your finger on the trigger....”
That warning proved to be correct, as the SP pulled Back to about $282.23 on 12/6/24, BUT my DMI & MFI were still +ive at COB 12/6/24 – so I held….
From 13/6/24 there has been a steady climb towards my Hidden Exit Point (see post 282 on page 15)…..
All of the “DrB 3 Inds” are still +ive as at 11am on 26/6/24, so this trade may run on, or crash & burn, whatever happens I consider this trade to be a success “at this stage” – will I hold or will I sell?.... My 3 Inds will tell me…. How +ive do you think my DrB 3 Inds are right now, would you sell or would you hold ?....
That pretty much explains my thought process up to this point today 11am 26/6/24….
Hope you can all follow my thought process....
No more posts on this scenario from me - you are all on your own, just follow the lead from the "DrB 3 Inds"....
Cheers..
DrB.
+ 1No Dr B. Just learnt from you
Well, Well, Well – Thanks to that Containment Candle Formation I reckon CSL will hit my $298.00 mark…. CSL hit $297.46 a few minutes ago…. Another $0.54c to go…. Bewdy Newk…. UNFORTUNATELY I got the timing wrong again, Back on 6/6/24, I calculated that CSL would hit $298-00 sometime on 26/6/24.... As Maxwell Smart would say, "Missed it by that much"....Ok Beginners, (and for the many doubters in the background) here is another example of the results you can obtain once you fully understand your chosen Indicators…..
Remember that I DO NOT provide Exact Entry/Exit points, or Exact Buy/Sell information….
Refer to the Chart Below, posted here on 6/6/24, Post #282, page 15….
View attachment 179326
View attachment 179327
From the Chart Above, you can see my personal entry point was $288.00 on 6/6/24….
That Entry point was dictated by the following TA…
A Containment Candle Formation (page 30) appeared on 30/5/24 & 31/5/24 just below the BCF Top Line (pages 197 -199)….
It was within a clearly defined ST Uptrend, and although that is not a requirement for this type of candle formation, it was still nice to see that….
My personal Entry point could have been a day earlier (5/6/24), but my that was my personal decision…. The ruling fact was that the candles for 3/6/24 & 4/6/24, were both RED, so I needed Green Candle AND a Confirmation Green Candle, that confirmation candle was there on 5/6/24, but, as explained in the 1st line on page 30, that was day 3 of the Confirmation Candles ST Life…. So my entry, as posted late on 6/6/24, was early 6/6/24 @ $288.00….
Then later, on Thursday 6/6/24, I posted the following (Post #282, page 15) – “For anyone following this current CSL Scenario, the next thing you would need to look at is your Exit Strategy, namely what date? and @ what price?....
There are enough clues within the following chart to indicate my personal early exit strategy....”
Then in post #283 (before open) on 7/6/24 I gave a warning – “Overnight CSL's ADR's were up 1.38% & 1.90% respectiely, but watch for the Friday Profit Takers, keep your finger on the trigger....”
That warning proved to be correct, as the SP pulled Back to about $282.23 on 12/6/24, BUT my DMI & MFI were still +ive at COB 12/6/24 – so I held….
From 13/6/24 there has been a steady climb towards my Hidden Exit Point (see post 282 on page 15)…..
All of the “DrB 3 Inds” are still +ive as at 11am on 26/6/24, so this trade may run on, or crash & burn, whatever happens I consider this trade to be a success “at this stage” – will I hold or will I sell?.... My 3 Inds will tell me…. How +ive do you think my DrB 3 Inds are right now, would you sell or would you hold ?....
That pretty much explains my thought process up to this point today 11am 26/6/24….
Hope you can all follow my thought process....
No more posts on this scenario from me - you are all on your own, just follow the lead from the "DrB 3 Inds"....
Cheers..
DrB.

No Dr B. Just learnt from you . ASX quoted as GUD until yesterday but now GUD code has been taken out today.
@Joe Blow - should the GUD thread be renamed then ?
BINGO - CSL hit $298.20 a few minutes ago - Mission Completed....Well, Well, Well – Thanks to that Containment Candle Formation I reckon CSL will hit my $298.00 mark…. CSL hit $297.46 a few minutes ago…. Another $0.54c to go…. Bewdy Newk…. UNFORTUNATELY I got the timing wrong again, Back on 6/6/24, I calculated that CSL would hit $298-00 sometime on 26/6/24.... As Maxwell Smart would say, "Missed it by that much"....
View attachment 179467

Hello and welcome to Aussie Stock Forums!
To gain full access you must register. Registration is free and takes only a few seconds to complete.
Already a member? Log in here.