Australian (ASX) Stock Market Forum

Roller's Intraday futures journey

That happened quick, change my mind and moved target to 27805 on a high-volume push down. Probably regret it but still (sim) money in the bank

1648607928055.png
 
That resistance held up for now. It actually went down to a zone I have marked so that was good to see.

Flipped long at 27 820, first target got hit at 875, next one is at 950. Stop is at break even now don't want to give any back.


1648613426961.png
 
This is a very valid point and something that I need to work on. I am definitely guilty of trying to buy at point A too often. Feel like I am getting better slowly


Unfortunately got stopped out on the rest of the position on that pullback. I didn't get back in once a recovered even though the trade was still valid. But I didn't see anything I was looking for. Oh well.

Once again it will be interesting lead from the US overnight, whether this area does break down or continues to hold.

There are a few levels above current price that I am keeping an eye on

1648620928219.png
 
I ended up getting a few trades in the afternoon and got back to break even after taking a few losses first up.

We got a nice attempt at overcoming prior resistance at that blue line and then drifted down in the afternoon to fill in some areas from the morning.

Overnight we broke the larger trading range that has formed over the last few weeks, so my focus will be on the short side but keeping an open mind. I'll be looking for a rally up to that first shaded area but I won't be jumping in straight away if we get there.

1648770161206.png
 
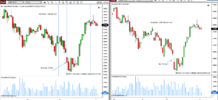
I don't know why but it seems that it is hard to find out what is a proper representation of a daily bar for the Nikkei.

I'm using Ninjatrader, and the default trading hours template is the OSE Nikkei mini which makes sense. But when you chart daily bars using this template it seems to miss Mondays… There is a another template; Default 24/7 I actually got recommended at one stage by Ninjatrader support to use this. The problem with this is is that it resets the daily bar at 12 AM New York time which I don't think is a proper representation of a daily bar for the Nikkei.

It seems as though this is what interactive brokers use as my IB charts match this.

Then to make matters more confusing in trading view it seems as though they reset the daily bar at the end of the day session for the Nikkei. So a new day starts when the overnight session starts. This sounds okay but then you get a bar that gets carried over the weekend.

I am hoping that there is some kind of bug somewhere in my Ninjatrader setup that they can fix the problem with the default OSE Nikkei mini template. I will upload some charts to show the issue.

I created a custom template to see if this solve the issue but this didn't seem to help either with the bars missing Monday.

1648970919124.png

1648971500789.png
 
Very quiet day today, no real movement as yet, I was short in the morning targeting those highlighted areas below current price. But with this slow grind up I got stopped out after lunch. Doesn't look like I'll be doing any other trades today.

1649049652613.png
 
In other news I entered 10 positions on a small ordinaries rotation system this month after the index filter kicked on, and it has taken off. Up around 10% in two days… Don't like the chances of that lasting
 
We have finally broken out of this range we have been for a few weeks.

Currently in a bit of freefall and can't see too much until 27 100-ish.

1649210205757.png


It could be a nasty few weeks, if we are to retrace this big run up that we had leading into this range, I'm not hundred percent sure how it will work out but with not much resistance on the way up you would think there is not going to be much holding price on the way back down either. As we have seen in the last hour or so

1649210537380.png
 
I often get confused on days like today when the market is moving quickly in one direction. I find it hard to maximise profit, I am either taking trades off the table too early with using price targets or giving a lot back.

For example at the moment I am short from the red line, I entered with two lots and I took one off at the first green line at an area where I thought was a possibility for a bounce.

I think overall price will want to go down into that shaded area and the blue line just above 27000 but on days when the market is dropping hard you can often get some sharp quick rallies.

And with no obvious place to trail a stop down I wonder what the best course of action is. Because I've already taken some profit off the table do I just put my stop to break even and let the trade play out or move it up to lock in some profits but not too close possibly around 350 area. I don't want to get stopped out on any short-sharp rallies , but you also don't want to give back a lot of profit if these rallies persist (especially when you don't get a lot of big winners).

Anyone have any suggestions


1649212866174.png
 
In a straight down move like that when a low is tested and it turns Id be out.
If the run is quick it will retrace often as quick as it rose.
The first sign of weakness---as they (Div man) says
 
In a straight down move like that when a low is tested and it turns Id be out.
If the run is quick it will retrace often as quick as it rose.
The first sign of weakness---as they (Div man) says
when you say when a low is tested, do you mean by that intraday low similar to a intraday double bottom or something like that? Or longrerm reversal point?

I have noticed that when you get a sharp move like this, you can get some nasty V shaped reversals
 
The low of the move in this timeframe.
27200 out at 27220-250.
Catching most of the move.
Can also swing it if quick taking advantage of those Nasty V bottoms and Tops.
Watch the volume.
Trading 5 min Id be watching 15 min and 3 for Indication. (Well that's what I do on the DAX)
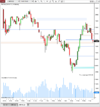
 
The low of the move in this timeframe.
27200 out at 27220-250.
Catching most of the move.
Can also swing it if quick taking advantage of those Nasty V bottoms and Tops.
Watch the volume.
Trading 5 min Id be watching 15 min and 3 for Indication. (Well that's what I do on the DAX)

Yeah I am not really trading any timeframe in particular, just posted that for visual purposes. I know what you mean though.

I mean even if I took my profits down there and it still went 200 points lower it is still a good trade, can't be greedy.

I am still holding though, currently retesting the shaded area just below 350. If we start getting closes into the zone then I am bailing .

Thanks
 
We ended up down at the zone around 27100 last night. The momentom is well and truly to the downside now but with some rotation around here it has started to slow.

For myself the high percentage plays will still be to the downside I think but watching some key areas around here

1649288465810.png
 
I said this morning to myself that the high percentage plays would be to the downside, once we got a drop hard from the open I just watched it go down for a hour and then tried to force some shorts once we have bottomed out. Not the smartest thing to do…

I think I finally got the daily bars sorted out properly, NT are looking into the issue that I bought up with them but I can get around it by having a 1440 minute chart and a custom template that I made. So now at least I'm confident that a bar starts in the morning and finishes when the overnight session does. To me this is the best representation of a full day. We have dipped down into some daily support so if this holds I would be looking for a bounce back up towards 27 400-ish. Although the bar isn't complete so see what happens. There is some signs of accumulation on the lower timeframe though.

1649316593713.png
 
We've had some rotation just above this daily level for a few days now, setting up pretty similar to what the textbooks say… Let's see if it plays out that way..

1649662556818.png
 
Top