Australian (ASX) Stock Market Forum

Roller's Intraday futures journey

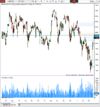
@Roller_1, step out to the larger timeframes and have a look at what is going on. Current price action on the daily is bullish - however this is in an overall bearish order flow delivery.

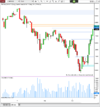
The last unmitigated zone on a daily is that highlighted in red. I would be looking to be bullish into this area to either look for:

a) weak to strong hand transfer (distribution) to continue the overall bearish delivery short OR
b) re-accumulation to continue higher

9XoWTb39
 
@Roller_1, step out to the larger timeframes and have a look at what is going on. Current price action on the daily is bullish - however this is in an overall bearish order flow delivery.

The last unmitigated zone on a daily is that highlighted in red. I would be looking to be bullish into this area to either look for:

a) weak to strong hand transfer (distribution) to continue the overall bearish delivery short OR
b) re-accumulation to continue higher

9XoWTb39

Yeah mate, I agree that the intermediate-term trend is up on the daily. But we still havent proved anything in the medium-long term.

I have been trying to trade it both ways (Not super successfully!) . But I have in mind that the trend is up. I just haven't expected it to be this vertical! We haven't really tested any areas on the way up, just brief pauses before heading up again.

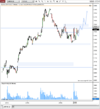
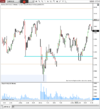
In trading view to you need to be careful with the futures charts, I think you need live data to be able to take into consideration contract differences. It is okay on the smaller timeframes when you are looking at the current contract, but when you are looking over multiple contracts there is a difference. In my chart below we are much closer to those daily levels that you have pointed out. Does anyone out there have live futures data in trading view?

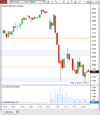
I was looking for a bit of a pullback this morning to target 27610 and those areas in the orange lines.

1647995353168.png
 
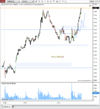
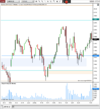
If you zoom right out on the daily, this general area has been somewhere that has provided some support/resistance over a long period of time, well the area we are approaching anyway. I know you don't use support/resistance too much in your own analysis but I have been trying to still take into consideration these areas while incorporating bits and pieces of other analysis.


1647996211828.png
 
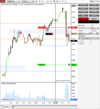
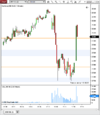
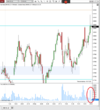
Only traded in the morning because I had to head out the office this afternoon. A few nice longs straight after the opening which was good.

I was looking for something like this in the afternoon session but didn't have a position on. I took a small long in my CFD account


1648101390914.png

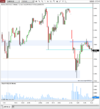
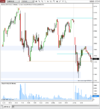
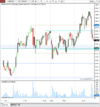
Always nice when you see a plan come together. A few months ago I probably would have just jumped straight on the short on that first failure up, slowly starting to get a better read the action I think.
1648101546457.png
 
@Roller - the Nikkei could be offering up a ripper short here. However, you would need to wait for a confirmation (I'd be looking at a 45 minute to an hourly chart to confirm a structural shift to the downside - using a timeframe any lower than this you are going to get too many false entries).

I'd be looking to target at least the liquidity point below. The weekly shows mega downside potential if the short setup presents itself.

Daily

5Qm3FqKz

Die please. That target is just in a random spot for now. We'll see how we go, really need to break this low

200.gif

1648170092310.png
 
What is the data package for futures is worth on tradingview? Ninjatrader can be a piece of sh it sometimes. The only problem is that I am using IB for my data, and hopefully to eventually trade I don't think trading view supports IB at the moment
 
Remember the mitigations. I like something like this (target also in random spot)

NTrweP0c
 
Remember the mitigations. I like something like this (target also in random spot)

NTrweP0c

Yet I am just not convinced that we are going to get back up there with that impulsive move. I took a small long off the lows this morning targeting a move back up but bailed around 27930. It is having a go at it though
 
Kaboom! We got your mitigation, crashing back down now will be interesting what happens. Was going to bail before my hard stop if we got a five-minute close in that shaded area but straight through it lol

1648173498696.png
 
What is the data package for futures is worth on tradingview? Ninjatrader can be a piece of sh it sometimes. The only problem is that I am using IB for my data, and hopefully to eventually trade I don't think trading view supports IB at the moment
$14.95 USD per month for the charting package and $1 USD per month for OSE futures data.
 
A busy day with a lot of trades for me. Ideally more than I would like. But I dug myself out of a bit of a hole early.

We are still in a larger zone which could produce some distribution on the longer timeframes. This has been discussed above.

I was long around 27700 looking for a rally back up to the opening price. But momentum came to a halt on the way up around the shaded area, with some distribution going on on the small timeframes. A rally back up towards the previous close could still be on the cards but is looking like if it does it will be in the overnight session.

I just got stopped out of a short at breakeven which was targeting 27700 going into the close.

Going to be watching from the sidelines for the rest of the day

1648443618835.png
 
got the push down to 27700, a pity we are going into the close as this could be a good long opportunity around here. We will see what happens at the open of the overnight session.

The close of the cash trading day is in three minutes. Sometimes after that there is a crazy rally/drop over the next 10-15 minutes so will be interesting if we get that

1648446968531.png
 
got the push down to 27700, a pity we are going into the close as this could be a good long opportunity around here. We will see what happens at the open of the overnight session.

That 27700 level held up quite nicely a couple of times overnight.

I'm still leaning to a possible larger distribution pattern but wary that we could be setting up for another move higher. I'll be looking to get long hopefully this morning targeting the 28150-ish area, any consolidation around this spot I will have a tight leash on and this could provide a possible opportunity to flip short.

1648510436719.png
 
A bit of an up-and-down day today. A good chance got offered up early to get in long which I was looking for before another push-up. Unfortunately the move didnt last and got stopped out on the pullback. I got a few ticks out of it but that just made up for a couple of false starts earlier in the day. I missed out on the afternoon move, once I realised what was going on I was a bit slow to pull the trigger and did not want to chase price.

I still think price will want to go up in between the blue line and 28150 above that to test this area before a breakdown. But I don't want to try and predict, just one of the things that I'm working on.

1648535392232.png
 
Just checked the charts to watch it burn through that first level. Very high-volume on the push-up through it. Definitely some liquidity laying around there. I think in the morning we may have a better picture of what the next few days will hold.

If this current level and the level around 28140 fails to hold. I will be feeling more confident towards the short side over the coming week or so.

Just anticipating possible scenarios, price should tell a clearer picture in the morning.


1648545594841.png
 
ust checked the charts to watch it burn through that first level. Very high-volume on the push-up through it. Definitely some liquidity laying around there. I think in the morning we may have a better picture of what the next few days will hold.

If this current level and the level around 28140 fails to hold. I will be feeling more confident towards the short side over the coming week or so.

Just anticipating possible scenarios, price should tell a clearer picture in the morning.

Overnight we got the push-up and some volatile price action above this larger range that has been forming over the last week or so. It is looking like those levels are going to fail to hold and if this overall range can break them lower prices could be on the cards over the coming week as we retrace some of the impulsive action coming up to this level.

I didn't get in at the open but once price was threatening on the upper range early on I got in short at 28135.
A bit annoyed at myself as there was quite a tight setup so I should have stuck to the two contracts I had on initially. But I got a bit spooked and stopped one out at breakeven, oh well.

I have given it a fair bit of room on the way down with my stop by keeping it wide. I was tempted to re-enter at the retest of 28050 but thought better of it. My target for now is 27780 but I will be watching that shaded area as this has proved to be quite strong resistance.

Also wary that price may want to come back up and retest the 28100 zone so keeping an open mind.

200.gif

1648606688817.png
 
Top