Australian (ASX) Stock Market Forum

Roller's Intraday futures journey

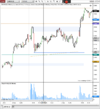
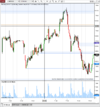
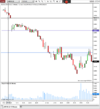
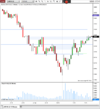
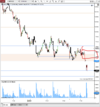
Well we definitely didn't break to the upside, ideally wait for a push-up into the red squiggle for a shorting opportunity. But then we will be above an area that has held up as daily support/resistance in the past... hmmm. So many gaps in the Nikkei compared to when you look at charts of the ES, a bit frustrating but it is what it is. But they can also provide opportunity if you get it right…

Not at the charts all day so it might be a tradeless day. Practicing my patients might not be such a bad thing!

200.gif


1649725260712.png
 
Update for the day.

I didn't do any trades today, and it was a pretty rough day for the Nikkei. A few minor reactions of some support levels but no real bounces. Funnily enough though I actually felt that it was a good learning day just watching this morning.


1649748456260.png
 
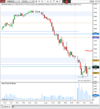
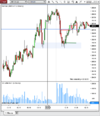
Starting to get close to some areas of interest for a short, I thought we were losing momentum and things were looking like it was going to change when we fill that gap but price marched on straight through it.


1649817251674.png
 
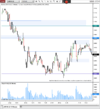
Alright let's see what happens. Price has closed today's session just below that zone, didn't really want to take a position 15 minutes from the close. Hopefully we don't get a big drop when we open into the night session.


1649832422302.png
 
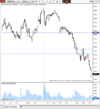
A nice reaction from the zone after the open of the night session. Drifted down to some old resistance which became support for setting up a little accumulation zone and pushing up. Currently around an area that has proved to be resistance in the past but price is having a go at getting through it.

1649902026133.png
 
Currently short from 27195, been holding most of the arvo. Closed 1 contract just below BE. areas of interest marked below current price. Stops at BE now incase it's loading up for another push up and i can't be at the screen all evening.

1649922143399.png
 
This is a bit of a medium term chart. Price action has been very choppy since Easter, low volume going into Easter and then some weird price action for the next couple of days afterwards. Looks like things are starting to clear out today with some nice moves.

A very strong rejection of resistance around 27390 this morning. I haven't been getting very good trades lately so it was nice to catch a chunk of this move, may have pulled the pin a bit early once I saw some momentum slowing up around a low of the day.

Not interested in any longs unless we get down around 26950. I actually thought price might be heading higher than where we got to this morning as there was a fair bit of momentum early, but once priced stalled just below 390 and then touched it with no follow-through it was on.


1650419722736.png
 
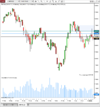
This is the current daily chart. The question is have we just pushed up to this level to retest the breakdown from the distribution area or do we want to keep trying to put in higher prices. The recent swing up to the 390 level hasn't been the most convincing and you could call it an ABC correction quite easily. If that is the case you would expect price to at least test that swing low, I need to keep in mind though that the recent daily bar still has a lot to go before it is complete

1650421468303.png
 
The overnight action was within yesterday's day session range. Got a reversal where I have marked up on the chart overnight so that is always good to see. Some levels have been marked up on the chart which I will take interest of it we get to them, I don't really want to trade too much inside of this range

1650498109305.png
 
A big run up in the morning, got a bit of what I thought was distribution going on around that 27 450 area, so I tried a small short there. But had a tight leash, so no damage done. In hindsight this was silly, we were still above at 390 support/resistance that held up yesterday so why would I want to short above there… The worst part was I was actually thinking this at the time, fomo I guess.


Pushed backup to some other resistance that has held up so far. Looking for a drift back towards 450 to close the day.


1650517013164.png
 
a rough overnight session printed a nasty looking daily bar.

Currently long from 26905 looking for a retrace. took 1 contract off @27015 and going to trail the other. but might be rolling over again. I'd like to give it more room but against the dominant trend. Nearly got stopped out at BE on the second contract..

1650594563933.png

Daily

1650592591405.png
 
Some nice moves in the day that @Cam019 will like.

Got in early at 26905 but unfortunately was too tight with my stop on the was up and got out early but oh well. Looking for a bounce overnight up to the shaded area for a first zone and some others above it. I wasn't at the charts in the afternoon so didn't get to watch any of the action. But just look like a slow grind up all day. There was no real pullback so bit disappointed to get shaken out early

Been using 65, 130 min charts as this gives me even bars on the chart instead of some some shorter ones. Also 390 min charts seem to be good. This gives me a full bar for the day session then 2 even bars over night.


1650613733784.png
 
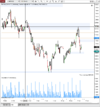
We currently have a interesting pattern setting up on the weekly charts. I've seen this pattern play out numerous times on mainly the smaller timeframes and I have have had some success trading on the lower timeframes (five and one minute). I haven't noticed it too much on the longer term charts, anything above daily so it will be interesting what happens over the coming few weeks. It is similar to a head and shoulders pattern just a bit uglier as the neckline gets broken and then the pullback tends to go deeper than the first turning point, obviously I am not the first one to notice it but I call it the long star.

There is usually heavy selling while coming down to a support level followed by a quick rally that normally tries to suck you in thinking that you have missed the turning point. This rally is followed by more heavy selling which normally tags a support level quite nicely, before rallying and breaking the initial high. The impulsive move off of support tends to leave a hollow candle where Price will pull back to before reversing and trending.

Thought I would put this here for future reference to see if it plays out.


1650776529214.png

A recent one from a few weeks ago, this played out on the 390 minute chart (three bars equates to one day). This one is probably more of a traditional head and shoulders pattern. Before trending up to a supply zone

1650777453536.png


In saying this we are coming off what looks like a large distribution pattern that lasted for several months so that first leg down might not be all that this run lower has in it.

While looking at the above chart and the daily chart a bit harder, volume definitely increase when we were pushing out of that distribution zone, it seems like people were getting out of their positions quick smart. This did coincide with the invasion of Ukraine so the larger volatility makes sense. The recent strong rally from the lows volume was diminishing as we were getting higher up into the previous range. The last few days as we reversed down volume again picked up and finished at its highest point for a few weeks on Friday.

So while the volume is increasing on the legs down it has not yet been supporting the rallies up, if we do get a turning point in that shaded area of the weekly chart it would be good to see some volume come in and support the run-up.

So all in all I want to stick to the downside unless we see a decent accumulation/reversal around the area of that prior rally up/shaded box. It is still a fair way down so if indeed that does happen you would expect the coming week to be a negative one.

I need to keep in mind that although this is a rough idea of what I think might happen I need to stick to what the chart is telling me and not take trades according to my bias.


1650779659484.png
 
What we will be symmetrical triangle break? It has swept the prior lows in the morning and accumulating the liquidity down there and then rallied higher to fill the gap. As per the plan from yesterday I got in short from what look like some distribution, it was a good entry but then bailed out way too quick even though we went down to exactly where I was targeting… Frustrating. Should have been well up for the day but coming out break even after a failed trade in the morning.

Conventional wisdom says the triangle should break in the way of the trend, but I'm thinking a pullback towards 26860 as first resistance and then up towards 27,000 if it can get through that.

1650864996042.png
 
I was a bit early looking for the trend change from the symmetrical triangle yesterday. In the end we had a nice accumulation zone and then a run up to the close to close just below the first part of resistance. In the past I have underestimated how far price travels from an accumulation zone like that so I'm not going to assume that we turn it this first part of resistance. We could get a pull back towards 26600-550 before resuming this uptrend.

I want to focus on my patients today so don't want to be over trading.
.
1650930038468.png
 
We got the pullback that I was looking for, I still entered too early when we got down there, I then bailed for a small loss before taking another position when it was looking more likely to reverse. I really need to cut these early trades out. Out now at the red lines. I was annoyed at my second exit as i thought we might b heading back towards the Highs (still might be) but banked the points. Momemtum dropped now but it's over lunch, see what the afternoon brings

1650941780012.png
 
Once we pushed up into the area where we dropped from in the morning, I was reluctant to short this area because we were above the accumulation zone that we had just tested.

I'm starting to think that we might not have enough gas in the tank to push back up to 27,000, see what happens overnight.

If we get a push up towards 26750 then I will watch price for any signs that wants to turn again. Although I might be better off leaving it as once again will be above the accumulation zone and support around 26700

1650957994189.png
 
Some having selling overnight., I don't really want to take any longs around here unless we push down to some lower levels. There are some levels marked up the shorts if we push up to that those areas. Once again I want to try and be patient and not get sucked into too many early trades.

The chart is very extended at the moment and it seems like there is a long way in between the levels. Let's see what today brings.

1651016710814.png
 
Had a go once we got to the first zone marked up stop but once price retrace their I realised that it still had some momentum and cut the trade.

I did not want to take a trade above the blue line as that was old support, once we break back through that I was looking for a retest but that hasn't come yet. If we push back up to the 250-270 level that I will be looking for a short opportunity

1651025418083.png
 
I ended up getting in long at 26185 once i notice some accumulation at previous support/resistance, it was a good entry and I planned to run it up to the 250 area and take some off. Once we got up there I did my best trick at doing something stupid and instead of letting some of the position ride and just bailed. I really need to work on my decisions under pressure, even though it is only sim it is strange what messes with your head. Especially because I've been trading systematically for a number of years so I am used to price fluctuations.

I planned to leave some on too see if we could get to the top of that shaded area where price got to in the end so that is frustrating. But I managed to get back in at 26280 on a spring after lunch.

possible larger accumulation type head and shoulders pattern has been set up. Looking to trade is up towards 26 400 as the first target and then 525 after that. But once we get towards the end of the day are will probably end up tightening my stop to take some profit. I took one lot off at this area and have the other one a breakeven

1651033882540.png
 
Top