Australian (ASX) Stock Market Forum

Roller's Intraday futures journey

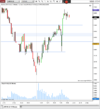
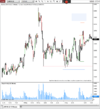
Looking to trade is up towards 26400 as the first target and then 525 after that.

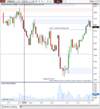
We got the push up and tagged 400 nicely before coming back to old resistance. 26525 is the next level I am watching above as well as 26245 below. Although if we push down to 26245 I am not sure if it is the best place for long trades as we could be resuming the downtrend. I don't put on too many trades in the evening session but if we get around these levels and I will watch for some
1651041606158.png


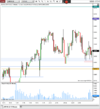
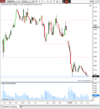
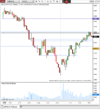
Some interesting volume traits over the last three or four bars. The last two red candles were last night's action where price dropped away pretty heavily. Although the volume was a lot lower than the bars leading up to these. The reversal today was on high-volume so something to take note of anyway at the end of the week to see what unfolds. Maybe some of the big boys stepping up today and buying these lower prices.
1651042376424.png
 
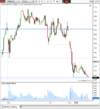
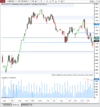
26525 is the next level I am watching

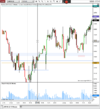
Pric flew up to this level, I got in at 515 targeting 26 400 as the first target. My stops at BE now and price has come within a tick about four times. And since I'm posting this chart I will probably get stoppd out within five minutes


1651052221345.png
 
My stops at BE now and price has come within a tick about four times. And since I'm posting this chart I will probably get stoppd out within five minutes

I think it was more like 10 minutes :p

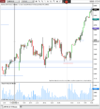
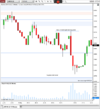
Looking for higher prices from this level, I'm hoping for a push down towards that red box for a chance to get in long. Hopefully I don't miss the boat. There is a interest rate decision at 12.30pm so that might get things moving, and then a speech at 3.30PM.

Once again though I don't want to blindly enter if we get down there, see what happens

1651106501841.png
 
Talk about trend day! Although I didn't get a piece of the action I'm still happy to see that I had the direction right

1651126755381.png
 
We currently have a interesting pattern setting up on the weekly charts. I've seen this pattern play out numerous times on mainly the smaller timeframes and I have have had some success trading on the lower timeframes (five and one minute). I haven't noticed it too much on the longer term charts, anything above daily so it will be interesting what happens over the coming few weeks. It is similar to a head and shoulders pattern just a bit uglier as the neckline gets broken and then the pullback tends to go deeper than the first turning point, obviously I am not the first one to notice it but I call it the long star.

There is usually heavy selling while coming down to a support level followed by a quick rally that normally tries to suck you in thinking that you have missed the turning point. This rally is followed by more heavy selling which normally tags a support level quite nicely, before rallying and breaking the initial high. The impulsive move off of support tends to leave a hollow candle where Price will pull back to before reversing and trending.

Thought I would put this here for future reference to see if it plays out.


View attachment 140794

A recent one from a few weeks ago, this played out on the 390 minute chart (three bars equates to one day). This one is probably more of a traditional head and shoulders pattern. Before trending up to a supply zone

View attachment 140796


In saying this we are coming off what looks like a large distribution pattern that lasted for several months so that first leg down might not be all that this run lower has in it.

While looking at the above chart and the daily chart a bit harder, volume definitely increase when we were pushing out of that distribution zone, it seems like people were getting out of their positions quick smart. This did coincide with the invasion of Ukraine so the larger volatility makes sense. The recent strong rally from the lows volume was diminishing as we were getting higher up into the previous range. The last few days as we reversed down volume again picked up and finished at its highest point for a few weeks on Friday.

So while the volume is increasing on the legs down it has not yet been supporting the rallies up, if we do get a turning point in that shaded area of the weekly chart it would be good to see some volume come in and support the run-up.

So all in all I want to stick to the downside unless we see a decent accumulation/reversal around the area of that prior rally up/shaded box. It is still a fair way down so if indeed that does happen you would expect the coming week to be a negative one.

I need to keep in mind that although this is a rough idea of what I think might happen I need to stick to what the chart is telling me and not take trades according to my bias.


View attachment 140797

It is a public holiday in Japan today so I'm just doing a bit of a weekly review.

I was looking for price to trade down into this shaded area during this week and then show some signs of accumulation or a reversal. We definitely got the latter in the last few sessions, with some strong volume coming in this week even though it is a shorter week. We also reclaim the level of the larger consolidation which was broke out of a few months ago.

1651199464725.png

The daily chart is below. I didn't think price would turn so sharply but here we are. Volume in this last week has been the highest for a few months now if price can break that recent high, then the resumption of the larger uptrend might have started. Although all we can do is trade what is on the chart so that is what I need to focus on

1651199751046.png
 
They seem to have a lot of public holidays in Japan! They had one last Friday and then three in a row this week.

Looks like some more time for reviewing
 
The market has just opened and has gapped down inside this what I thought could have been an accumulation zone before 3 public holidays in a row. I thought we might have got a push-up from this area to close the gap towards 27 200. A lot has gone on in the US over these days with the Fed and other announcements, so might be a volatile day.

In the larger picture I was still leaning towards an upward bias but if this area breaks as well as the low point down the bottom then that might be out of the picture.

Anyway I think I'm going to let this play out for a while to see what way it wants to go.

I definitely have an issue with over trading so that has been my focus the last while and going forward is to not assume the market is going to do what I think it's going to do and let it play out a bit more before putting on a trade.

1651794988246.png
 
Practising my patience worked well today, ironically there was a setup that I would normally take at the low of the day for a long but I didn't want to rush into things so I left it. I still think this was the right move i ended up getting in around 26750 and exited the final contract near the higher the day.

The me the chart was setting up for a run higher despite what has been going on in the world and the markets so we'll see what happens tonight if that gap gets filled


1651821704814.png
 
After a big drop in the morning prices have been range bound for most of the afternoon. I did not get a piece of the initial drop but got in short after the first pullback and got most of that move down. Unfortunately got stopped out of breakeven on the second leg back up near where it turned.

After looking at some of my MAE and MFE stats I decided that if the setup is right I am better off trading three contracts instead of two. This provides a bit more flexibility with profit-taking and leaving one on too run. I'm not really sure if it is the right move yet but between that and trying to be more selective with my entries we'll see what happens.

Only two trades today, probably should have only been one I was a bit too keen in the afternoon trying for a long. Even though I was eyeing a potential spring setup, I took one in the middle of the range… Patience is a work in progress. We will see if this area holds going into the close, steering clear of it for now

1652075560597.png
 

Attachments

  • 1652075393632.png
    1652075393632.png
    40.6 KB · Views: 0
There was a couple of trades today that I could have taken but haven't so far.

The first one was just after the open when we tested a shprt term overnight resistance/ turning level. I did not really want to take this short as we have just bounced off longer-term support around 25 950 and with the gap up I thought it might want to run a bit in the morning. I was looking for a push-up to that higher shaded area just above it or the blue line which is longer-term resistance.

Something I am noticing though is when price is pretty volatile and likes to turn at the first chance it gets if the setup is right.


The next one was the long off of accumulation zone down the bottom of the chart. The reason I hesitated on taking this one is that I thought it might like to go down and test where I had marked up support just below it. It is looking like I had that placed at a incorrect level in hindsight. I marked up on a shorter term chart where I would have got in the long as it was unfolding and would have taken little heat on the trade but oh well. It's a fine line between being to patient and getting into early… I guess the positive I take out is that I saw these trades as they were unfolding and not after-the-fact.

then I did a silly trade of trying to get in short on the retest of 25960ish but being just above that accumulation zone it wasn't the smartest move. Especially when you take a step back and say if I did get in long off that accumulation zone I would still be holding the long, so why would I want to get short here. Probably some kind of subconscious revenge trade..

If price drifts back and wants to test the top of the accumulation zone then this could be a chance for another long. Otherwise if we move up from this area to test the zones just above 26200 i'll be watching for some distribution to unfold.


1652150205268.png
 
Only one other trade for me today. I wait until we got up to that supply zone/ resistancethat I was looking for and just got a short scalp into the close to get back above breakeven for the day.

The only other trade i really see was the retest of that 960 area but that was pretty sure and sharp. I have learned that I don't have too many short-term trade setups so I need to be more selective. Possibly these might come in over time but I just want to try and stick to one thing for now.

Waiting for price to get to predefined levels.


1652164904874.png
 
Morning all, ideally this morning I am looking for a short targeting the shaded box around yesterday's accumulation zone. Price has stalled around this area so possibly we could be setting up for a another short rally up to some high levels before breaking down again.


1652225985730.png
 
I got in short at 26210 on a high-volume push-up with no follow-through. I have taken some profits but I still have one contract on. But it looks like there might be some accumulation going on, if we get a push back down to 26080ish I might look for a chance to get long. But this could also rip through my stop at breakeven shortly.

1652233155504.png
 
Some nice moves last night. Price testing a zone I had marked up above where we ended the session yesterday and then dropping away eventually to close near the zone where I was targeting yesterday morning.

From here it is hard to say whether we will want to push below the accumulation zone to the left of the chart before a possible reversal or if it is going to take off early. If we break below this larger consolidation area down to around 25700 that could be another area where price may like to sping from.

So I am cautiously looking for longs around this area.


1652312059382.png
 
From here it is hard to say whether we will want to push below the accumulation zone to the left of the chart before a possible reversal or if it is going to take off early. If we break below this larger consolidation area down to around 25700 that could be another area where price may like to sping from.

So I am cautiously looking for longs around this area.

We got a big fat Royal flush straight below the the accumulation area from a few days ago (pink line) I had already put on a long before that so are my stop got hit on the way down. Although I got stopped out I don't think it was a too bad a trade, probably rushed too much but it is what it is.

Once price dropped hard into the zone around 25700 on huge volume (I think there was around 17,000 contracts in one minute) with no follow-through it was looking like capitulation to me. I did not want to get in below the pink line though so waited for price to recover and got in one tick above it once that held.

I bailed on one contract way too early, I think this was due to the early loss and just wanting to make up for that. My initial target for the first contract was the morning high which got broken not long after. I have taken another one off at the high of the current bar. I'm just going to let the last contract ride hoping for a push-up towards 26180-ish.

My stop is just below 25900, it's hard to know what to do in this situation too lock in profits or just give it some room to move. I'm going for the latter

1652322539063.png
 
Basically from my last post price just drifted down for the whole day. I ended up getting stopped out around 25890 but still that was a good trade I think. I did not do any more trades to the rest of the day. I may have considered flipping short if we pushed up a bit higher from the high up towards that swing point but probably not because overall I thought we may have pushed above that to where I was targeting in the earlier post.

Where price is now maybe currently testing the spring that set up early in the day but time will tell.

1652336109957.png
 
I have been away from the charts for a few days but it is good to be back.

Some nice moves on Friday and yesterday also so that is always good to see. Very impulsive move up on Friday, before continuing overnight.

A gap up yesterday morning to fill an old gap from a few months ago before dropping away hard.

I'm currently long from the bottom of this accumulation zone looking for a push-up to yesterday's level before retracing once again.

1652747522972.png

I probably got a bit lucky on the entry as as soon as price hit my limit it just took off, so I could have easily missed it but I'll take it.

Once we went through my first target I moved a stop up for another contract to that level which just got it. So I have my last stop at breakeven, still targeting the shaded box at the top for a area to reverse. Whether or not it gets their time will tell

1652747814802.png
 
Still holding the last contract but have just moved my stop up 26590. Would be good to see it continue on but if I get stopped out there I will still be happy. Also moved my final target down a fraction after reviewing some previous price action to the left

1652759523553.png
 
I ended up exiting at the close. It would have been good to hold it into the evening session but it could have easily gapped down too so I'm happy with where it ended up.

The shaded area is still a place for a possible reversal in my opinion, if we get there early into the overnight session then I may monitor for some distribution going on.

But also need to keep in mind that we are coming off a decent size accumulation zone, so it might have some more momentum to the upside left in it once we get up there


1652769199890.png
 
Top