- Joined
- 13 February 2006
- Posts
- 4,991
- Reactions
- 11,204
Oil News:
Immediately after Donald Trump’s re-election as US president was confirmed, clean energy stocks have plunged with solar producers such as Sunnova or First Solar plunging by 50% and 20%, respectively, in just one day.
- Renewable energy developers paused several investments over the past week until there’s more policy clarity from the future Trump administration, having already invested $450 billion in new projects since the passage of the IRA.
- Whilst Trump’s stance vis-à-vis the IRA remains vague, analysts estimate that renewable deployment could fall 30% if currently offered tax credits are phased out and there are new tariffs on imported equipment.
- Solar and wind capacity grew 32% and 69% respectively during Trump’s first term as president while overseeing a doubling of EV sales between 2016 and 2020, albeit from a lower baseline.
Market Movers
- QatarEnergy agreed to buy a 23% stake from US oil major Chevron (NYSE:CVX) in the North El-Dabaa offshore exploration block in Egypt for an undisclosed sum, expanding its global footprint.
- UK-based energy major Shell (LON:SHEL) confirmed a discovery with its 130 BCf Selene gas prospect in the UK North Sea, hitting a 100-meter net gas column at a water depth of 3,370m.
- US shale firm Ovintiv (NYSE:OVV) surpassed analyst expectations with its Q3 results, citing the fastest-ever quarter for drilling speed, up 28% year-over-year at more than 2,170 feet per day drilled.
Tuesday, November 12, 2024
While US markets are speculating about Trump’s pick for Energy Secretary, oil futures have been steadily declining with WTI dipping well below $70 per barrel and ICE Brent holding out at $72 per barrel. Unimpressive inflation data as well as disappointing stimulus measures have put China back into the limelight, further squeezed by the ongoing strengthening of the US dollar. OPEC has since added to demand concerns by cutting its oil demand forecast for a fourth consecutive month.
Trump May Pull Out of Paris Climate Agreement. Just as the COP29 conference is about to start in Baku, the future Trump administration might withdraw from the Paris climate agreement and ease US commitments to allow more drilling and mining, as well as lifting the Biden-era LNG permitting ban.
White House Finalizes SPR Refillments. In the last installment of the Biden Administration's SPR replenishments, the US Department of Energy bought 2.4 million barrels of sour crude from Macquarie and midstream firm Energy Transfer, to be delivered in April-May 2025 to Bryan Mound.
Shell Wins Landmark Appeal Against Dutch State. The Appeals Court in the Hague dismissed a 2021 ruling that ordered Shell (LON:SHEL) to cut its total carbon emissions by 45% by 2030 compared to 2019 levels, based on a case brought by climate activist group Friends of the Earth.
Ukraine Hikes Gas Transit Fees. With Europe tacitly watching the Ukraine-Russia gas transit drama, Kyiv wants to more than double entry tariffs for natural gas transportation for 2025-2029, citing a substantial decline in transportable volumes and changing the currency of tariffs to euros.
Saudi Exports to China Disappoint Again. Saudi Arabia’s crude oil deliveries to China are expected to fall to 36.5 million barrels in December, the second straight month-over-month decline after 37.5 million barrels in November and 46 million barrels in October, attesting to weak Chinese demand.
Russia Mulls Merging Of Key Oil Companies. According to the Wall Street Journal, Russia is considering merging its three largest oil companies Rosneft, Gazprom Neft, and Lukoil to create the world’s second-largest oil producer, although the companies themselves have refuted this.
Beijing and Jakarta Double Down on Metals. In his first presidential visit as Indonesia’s new President, Prabowo Subianto flew to China, agreeing to build a new nickel smelter in Central Sulawesi and expanding cooperation between the two states into lithium batters and photovoltaics.
COP29 Starts with Carbon Credit Breakthrough. COP29 participants in Baku have adopted new standards for carbon credits under the Paris Agreement, although there is still no agreement on how countries can use their carbon credits to meet their greenhouse gas reduction targets.
US to Triple Nuclear Capacity by 2050. Before leaving office, the Biden administration could formalize a 2050 target to triple nuclear power capacity by 2050, deploying an additional 200 GW of new reactors to the 100 GW existing, as the idea of boosting nuclear enjoys bipartisan support.
India’s Coal Demand Boom Slows Down. India’s imports of thermal coal dipper by a third year-over-year, falling to 13.56 million tonnes and marking the first consecutive decline in more than a year, thanks to improving hydropower and solar generation as overall power output has also been cooling.
Copper Prices Plunge on Trump Disruption Risk. Front-month copper futures extended their slide this week, with COMEX prices falling to $9,320 per metric tonne, shedding 6% since the re-election of Donald Trump raised risks of a global economic slowdown in case the 60% China tariff is implemented.
India Doubles Down on Its Oil Ambition. India’s Oil Minister Hardeep Puri stated the South Asian nation will see rising fossil fuels demand until at least 2040, reiterating its ambition to boost refining capacity by 80% to 9 million b/d and meet a net zero emission target by 2070.
Angola Lures Oil Investors With Forgotten Fields. Angola’s government has offered 10 dormant discoveries once found by oil majors that subsequently never tapped into them to oil investors, scattered across four offshore blocks and containing a proven reserve total of 500 million barrels.
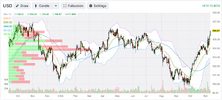
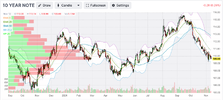
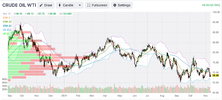
The only thing holding the market higher currently is the low POO.
If POO was higher, the USD at these levels would be causing UST dysfunction.
Some history:
Politicians shouldn’t judge themselves by the stock market. But it’s happening again. Here follow some cautionary tales on what the post-election rally in stocks does and does not portend for the US economy over the next four years.
Scott Bessent, for many years a leading investor for George Soros, may very well be the next Treasury secretary. The Polymarket prediction market (which hasn’t gone away) puts his chances at 70%. In an important op-ed for the Wall Street Journal, he has set out an agenda for economic policy that’s worth reading. Headed “Markets Hail Trump’s Economics,” it makes this claim:
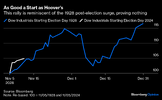
In the following chart, I have compared the Dow Industrials’ performance from Election Day in 1928, when Herbert Hoover was chosen president, to its performance since a week ago. They’re very similar:
Does this prove that Donald Trump’s second term will pan out like Hoover’s? Of course it doesn’t. And that’s just as well, as this is what happened to the Dow in the four years between Hoover’s election and his landslide defeat to FDR in 1932:
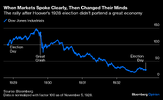
Again, to be clear, a primitive overlay chart is no kind of evidence that the stock market is destined for a crash like 1929. The point is that the post-election rally doesn’t prove anything either way.
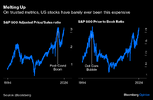
What predictions can we more safely make? Generally, the single most important factor in the long-term performance of an investment is the price at which you bought it. If it was too expensive, you’re much less likely to do well out of it. This is how two of the most simple valuation metrics for the S&P 500 — its ratio to sales and its ratio to book value — have moved over the last 30 years. On the former, the market is very close to the record set in the the post-Covid boom in 2021. On the latter, it’s almost taken out the all-time high from the dot-com bubble in 2000:
Nothing proves that the stock market is about to fall as it did on those two occasions. But the higher the valuation, the higher the odds against continued strong performance. In general, it would be unwise for any politician to seek to be judged by share prices at present, as it involves setting a target on their back.
Using a subtler metric, Robert Shiller’s CAPE (cyclically adjusted price/earnings) multiple aims to correct for the market’s moves within the economic cycle by comparing share prices to average inflation-adjusted earnings over the previous decade. Shiller has calculated the ratio back to 1881, and the following chart is taken from his website. On this basis, only one presidential election has previously taken place with the stock market so expensive, in 2000, when George W. Bush emerged victorious. The CAPE is calculated monthly. On Nov. 1, 2000, it was 38.78; on the first of this month, it stood at 38.11:
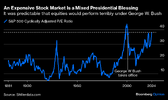
With this post-election rally, the CAPE is now higher than when Bush took office in 2001, amid the fallout from the dot-com implosion. It’s possible that Trump 2.0 will unleash a new paradigm for stock investing and take valuations to previously unimagined heights. It’s more likely that performance won’t be great, for reasons that have nothing to do with his economic policies.
Beyond stocks, other post-election Trump Trades also urge caution. The spread of high-yield bonds’ yields over Treasuries, a crucial measure of the compensation you receive for lending to companies with weak credit, has dropped to a 17-year low in recent days, according to Bloomberg indices. The spread was only tighter for a matter of days in the summer of 2007. On that occasion, spreads rose quickly as the structured credit market based on subprime mortgages began the collapse that ended with the Global Financial Crisis:
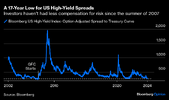
Again, this absolutely doesn’t prove, or even suggest, that we’re about to stage a repeat of the GFC. It does, however, strongly indicate that markets are very ungenerously priced for anyone who wants to enter. Any worsening of credit conditions, starting from these highs, would hurt. It might be wise for incoming politicians to talk down the significance of the stock market, emphasize that it looks expensive, and seek to be judged by more or less any other metric.
There is one important market, however, where the immediate post-election Trump Trade has reversed, and this is healthy. Treasury bond yields surged higher as the results came in, signaling alarm that tax cuts and tariffs would mean inflation and higher rates from the Federal Reserve. But after surging some 20 basis points in a matter of hours, the bond market (closed Monday for Veterans Day) calmed down swiftly. By the close on Friday, it had completed a round trip:
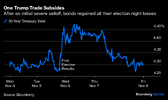
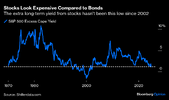
It might make sense for the Trump team to treat this as a meaningful shot across its bow, but also take some comfort that there wasn’t appetite to keep yields that high. Even back at 4.3%, the 10-year yield makes it somewhat harder to justify current stock market valuations. Another chart from Shiller’s website shows the extra cyclically adjusted yield paid by stocks compared to long-term bond yields. The lower the excess yield, the less attractive stocks look compared to bonds:
One critical component of bond yields is the policy rate set by the central bank. At the beginning of October, the fed funds futures seemed convinced that policy rates would fall below 3% by January 2026. Now, that figure is close to 4%. The shift in rate-cut expectations as confidence took hold that Trump would return to the White House has been something to behold:

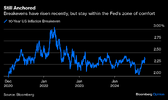
This is good for the Trump administration in that the Fed has less need to cut rates if the economy is growing, so it does show some confidence in growth. But it also suggests that price rises will make it harder to cut. Conventional wisdom has already coalesced on the notion that the Democrats’ defeat was chiefly attributable to their failure to stop the inflation spike. It’s politically imperative to avoid another one. On this front, the bond market is less emphatic. Two months ago, the 10-year inflation breakeven, its implicit forecast of average inflation for the next 10 years, came close to 2.0%, the Fed’s target. In the aftermath of the election, it touched 2.4%. The good news is that it has ticked back a little from there, and remains lower than for much of the last two years:
There’s no great reason for alarm in the bond market. The vigilantes are keeping a watching brief for now. But the markets are not signaling confidence in lower inflation, while fed funds expectations make it harder for stocks to keep rallying.
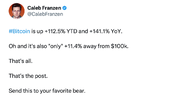
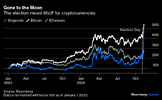
All of this said, when markets develop momentum, it’s dangerous to get in their way. The crypto market shows clear evidence of frothy excess, but it also shows very strong confidence that will be difficult to dislodge:
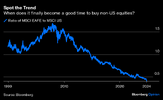
And trends, once established, are difficult to change. For the most spectacular example, this is how the MSCI EAFE index (for Europe, Australasia and the Far East, effectively the non-US developed markets) has performed relative to the US over the last 25 years. EAFE has dropped in absolute terms since the election (so a Trump victory isn’t being hailed as a positive development outside the US). Unlike America, stocks in these countries almost all look quite cheap on metrics such as the CAPE. But who is going to have the courage to get in the way of a trend like this one?
In conclusion: Yes, the markets have had a positive response to the election. The calmness of bond yields is actually more important and reassuring than the rally in stocks. And with stocks looking exceptionally expensive, it’s very, very unwise for any politician to ask to be judged by them.
jog on
duc
Immediately after Donald Trump’s re-election as US president was confirmed, clean energy stocks have plunged with solar producers such as Sunnova or First Solar plunging by 50% and 20%, respectively, in just one day.
- Renewable energy developers paused several investments over the past week until there’s more policy clarity from the future Trump administration, having already invested $450 billion in new projects since the passage of the IRA.
- Whilst Trump’s stance vis-à-vis the IRA remains vague, analysts estimate that renewable deployment could fall 30% if currently offered tax credits are phased out and there are new tariffs on imported equipment.
- Solar and wind capacity grew 32% and 69% respectively during Trump’s first term as president while overseeing a doubling of EV sales between 2016 and 2020, albeit from a lower baseline.
Market Movers
- QatarEnergy agreed to buy a 23% stake from US oil major Chevron (NYSE:CVX) in the North El-Dabaa offshore exploration block in Egypt for an undisclosed sum, expanding its global footprint.
- UK-based energy major Shell (LON:SHEL) confirmed a discovery with its 130 BCf Selene gas prospect in the UK North Sea, hitting a 100-meter net gas column at a water depth of 3,370m.
- US shale firm Ovintiv (NYSE:OVV) surpassed analyst expectations with its Q3 results, citing the fastest-ever quarter for drilling speed, up 28% year-over-year at more than 2,170 feet per day drilled.
Tuesday, November 12, 2024
While US markets are speculating about Trump’s pick for Energy Secretary, oil futures have been steadily declining with WTI dipping well below $70 per barrel and ICE Brent holding out at $72 per barrel. Unimpressive inflation data as well as disappointing stimulus measures have put China back into the limelight, further squeezed by the ongoing strengthening of the US dollar. OPEC has since added to demand concerns by cutting its oil demand forecast for a fourth consecutive month.
Trump May Pull Out of Paris Climate Agreement. Just as the COP29 conference is about to start in Baku, the future Trump administration might withdraw from the Paris climate agreement and ease US commitments to allow more drilling and mining, as well as lifting the Biden-era LNG permitting ban.
White House Finalizes SPR Refillments. In the last installment of the Biden Administration's SPR replenishments, the US Department of Energy bought 2.4 million barrels of sour crude from Macquarie and midstream firm Energy Transfer, to be delivered in April-May 2025 to Bryan Mound.
Shell Wins Landmark Appeal Against Dutch State. The Appeals Court in the Hague dismissed a 2021 ruling that ordered Shell (LON:SHEL) to cut its total carbon emissions by 45% by 2030 compared to 2019 levels, based on a case brought by climate activist group Friends of the Earth.
Ukraine Hikes Gas Transit Fees. With Europe tacitly watching the Ukraine-Russia gas transit drama, Kyiv wants to more than double entry tariffs for natural gas transportation for 2025-2029, citing a substantial decline in transportable volumes and changing the currency of tariffs to euros.
Saudi Exports to China Disappoint Again. Saudi Arabia’s crude oil deliveries to China are expected to fall to 36.5 million barrels in December, the second straight month-over-month decline after 37.5 million barrels in November and 46 million barrels in October, attesting to weak Chinese demand.
Russia Mulls Merging Of Key Oil Companies. According to the Wall Street Journal, Russia is considering merging its three largest oil companies Rosneft, Gazprom Neft, and Lukoil to create the world’s second-largest oil producer, although the companies themselves have refuted this.
Beijing and Jakarta Double Down on Metals. In his first presidential visit as Indonesia’s new President, Prabowo Subianto flew to China, agreeing to build a new nickel smelter in Central Sulawesi and expanding cooperation between the two states into lithium batters and photovoltaics.
COP29 Starts with Carbon Credit Breakthrough. COP29 participants in Baku have adopted new standards for carbon credits under the Paris Agreement, although there is still no agreement on how countries can use their carbon credits to meet their greenhouse gas reduction targets.
US to Triple Nuclear Capacity by 2050. Before leaving office, the Biden administration could formalize a 2050 target to triple nuclear power capacity by 2050, deploying an additional 200 GW of new reactors to the 100 GW existing, as the idea of boosting nuclear enjoys bipartisan support.
India’s Coal Demand Boom Slows Down. India’s imports of thermal coal dipper by a third year-over-year, falling to 13.56 million tonnes and marking the first consecutive decline in more than a year, thanks to improving hydropower and solar generation as overall power output has also been cooling.
Copper Prices Plunge on Trump Disruption Risk. Front-month copper futures extended their slide this week, with COMEX prices falling to $9,320 per metric tonne, shedding 6% since the re-election of Donald Trump raised risks of a global economic slowdown in case the 60% China tariff is implemented.
India Doubles Down on Its Oil Ambition. India’s Oil Minister Hardeep Puri stated the South Asian nation will see rising fossil fuels demand until at least 2040, reiterating its ambition to boost refining capacity by 80% to 9 million b/d and meet a net zero emission target by 2070.
Angola Lures Oil Investors With Forgotten Fields. Angola’s government has offered 10 dormant discoveries once found by oil majors that subsequently never tapped into them to oil investors, scattered across four offshore blocks and containing a proven reserve total of 500 million barrels.


The only thing holding the market higher currently is the low POO.
If POO was higher, the USD at these levels would be causing UST dysfunction.

Some history:
Politicians shouldn’t judge themselves by the stock market. But it’s happening again. Here follow some cautionary tales on what the post-election rally in stocks does and does not portend for the US economy over the next four years.
Scott Bessent, for many years a leading investor for George Soros, may very well be the next Treasury secretary. The Polymarket prediction market (which hasn’t gone away) puts his chances at 70%. In an important op-ed for the Wall Street Journal, he has set out an agenda for economic policy that’s worth reading. Headed “Markets Hail Trump’s Economics,” it makes this claim:
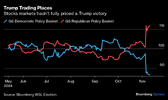
It’s necessary to be careful with this. Asset prices are indeed so fickle that it’s unwise to draw too many conclusions just yet even from the emphatic rally that has followed the election. It’s certainly true that the stocks thought most likely to benefit from a Trump administration, rather than from a Democratic alternative, have enjoyed quite a rally, and shown that the victory was not priced in before Election Day:Asset prices are fickle, and long-term economic performance is the ultimate measuring stick. But recent days prove markets’ unambiguous embrace of the Trump 2.0 economic vision. Markets are signaling expectations of higher growth, lower volatility and inflation, and a revitalized economy for all Americans.

In the following chart, I have compared the Dow Industrials’ performance from Election Day in 1928, when Herbert Hoover was chosen president, to its performance since a week ago. They’re very similar:

Does this prove that Donald Trump’s second term will pan out like Hoover’s? Of course it doesn’t. And that’s just as well, as this is what happened to the Dow in the four years between Hoover’s election and his landslide defeat to FDR in 1932:

Again, to be clear, a primitive overlay chart is no kind of evidence that the stock market is destined for a crash like 1929. The point is that the post-election rally doesn’t prove anything either way.
What predictions can we more safely make? Generally, the single most important factor in the long-term performance of an investment is the price at which you bought it. If it was too expensive, you’re much less likely to do well out of it. This is how two of the most simple valuation metrics for the S&P 500 — its ratio to sales and its ratio to book value — have moved over the last 30 years. On the former, the market is very close to the record set in the the post-Covid boom in 2021. On the latter, it’s almost taken out the all-time high from the dot-com bubble in 2000:

Nothing proves that the stock market is about to fall as it did on those two occasions. But the higher the valuation, the higher the odds against continued strong performance. In general, it would be unwise for any politician to seek to be judged by share prices at present, as it involves setting a target on their back.
Using a subtler metric, Robert Shiller’s CAPE (cyclically adjusted price/earnings) multiple aims to correct for the market’s moves within the economic cycle by comparing share prices to average inflation-adjusted earnings over the previous decade. Shiller has calculated the ratio back to 1881, and the following chart is taken from his website. On this basis, only one presidential election has previously taken place with the stock market so expensive, in 2000, when George W. Bush emerged victorious. The CAPE is calculated monthly. On Nov. 1, 2000, it was 38.78; on the first of this month, it stood at 38.11:

With this post-election rally, the CAPE is now higher than when Bush took office in 2001, amid the fallout from the dot-com implosion. It’s possible that Trump 2.0 will unleash a new paradigm for stock investing and take valuations to previously unimagined heights. It’s more likely that performance won’t be great, for reasons that have nothing to do with his economic policies.
Beyond stocks, other post-election Trump Trades also urge caution. The spread of high-yield bonds’ yields over Treasuries, a crucial measure of the compensation you receive for lending to companies with weak credit, has dropped to a 17-year low in recent days, according to Bloomberg indices. The spread was only tighter for a matter of days in the summer of 2007. On that occasion, spreads rose quickly as the structured credit market based on subprime mortgages began the collapse that ended with the Global Financial Crisis:

Again, this absolutely doesn’t prove, or even suggest, that we’re about to stage a repeat of the GFC. It does, however, strongly indicate that markets are very ungenerously priced for anyone who wants to enter. Any worsening of credit conditions, starting from these highs, would hurt. It might be wise for incoming politicians to talk down the significance of the stock market, emphasize that it looks expensive, and seek to be judged by more or less any other metric.
There is one important market, however, where the immediate post-election Trump Trade has reversed, and this is healthy. Treasury bond yields surged higher as the results came in, signaling alarm that tax cuts and tariffs would mean inflation and higher rates from the Federal Reserve. But after surging some 20 basis points in a matter of hours, the bond market (closed Monday for Veterans Day) calmed down swiftly. By the close on Friday, it had completed a round trip:

It might make sense for the Trump team to treat this as a meaningful shot across its bow, but also take some comfort that there wasn’t appetite to keep yields that high. Even back at 4.3%, the 10-year yield makes it somewhat harder to justify current stock market valuations. Another chart from Shiller’s website shows the extra cyclically adjusted yield paid by stocks compared to long-term bond yields. The lower the excess yield, the less attractive stocks look compared to bonds:

One critical component of bond yields is the policy rate set by the central bank. At the beginning of October, the fed funds futures seemed convinced that policy rates would fall below 3% by January 2026. Now, that figure is close to 4%. The shift in rate-cut expectations as confidence took hold that Trump would return to the White House has been something to behold:

This is good for the Trump administration in that the Fed has less need to cut rates if the economy is growing, so it does show some confidence in growth. But it also suggests that price rises will make it harder to cut. Conventional wisdom has already coalesced on the notion that the Democrats’ defeat was chiefly attributable to their failure to stop the inflation spike. It’s politically imperative to avoid another one. On this front, the bond market is less emphatic. Two months ago, the 10-year inflation breakeven, its implicit forecast of average inflation for the next 10 years, came close to 2.0%, the Fed’s target. In the aftermath of the election, it touched 2.4%. The good news is that it has ticked back a little from there, and remains lower than for much of the last two years:

There’s no great reason for alarm in the bond market. The vigilantes are keeping a watching brief for now. But the markets are not signaling confidence in lower inflation, while fed funds expectations make it harder for stocks to keep rallying.
All of this said, when markets develop momentum, it’s dangerous to get in their way. The crypto market shows clear evidence of frothy excess, but it also shows very strong confidence that will be difficult to dislodge:

And trends, once established, are difficult to change. For the most spectacular example, this is how the MSCI EAFE index (for Europe, Australasia and the Far East, effectively the non-US developed markets) has performed relative to the US over the last 25 years. EAFE has dropped in absolute terms since the election (so a Trump victory isn’t being hailed as a positive development outside the US). Unlike America, stocks in these countries almost all look quite cheap on metrics such as the CAPE. But who is going to have the courage to get in the way of a trend like this one?

In conclusion: Yes, the markets have had a positive response to the election. The calmness of bond yields is actually more important and reassuring than the rally in stocks. And with stocks looking exceptionally expensive, it’s very, very unwise for any politician to ask to be judged by them.
jog on
duc

