Australian (ASX) Stock Market Forum

KISS Trading with Ann

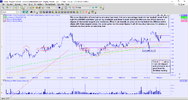
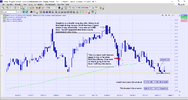
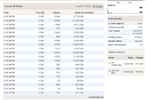
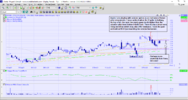
Let's look at how KISS did this week, sold two companies, made some reasonable $$$ along the way. The first I will talk about is ORA which I sold for $3.63 on Thursday. Again I am trading using volume spikes as a guide. There was a volume spike halfway down a fall. Generally, I am seeing after the fall, the recovery only comes up to the V spike horizontal level or slightly above before it falls back. I took the opportunity to sell even though I only managed an extremely meagre % increase of 6.32%. I felt it prudent to sell under current conditions as I doubt a packaging company will set investors on fire enough to want to buy above a double top. Could be wrong of course. However, a small profit is better than a loss. If I lose some upside....gosh, I will just have to suck it up! :happy:

ORA sold 11.3.22.png


My other sale of the week was SMR and the renounceable rights attached on Tuesday after the Monday ex-rights date. There was an offer of 7 rights for every 3 shares held. I sold the company and then half the rights. I decided I was a dill to hold half the rights and sold the second half immediately just holding back about 530ish RRs, enough for a marketable parcel which would give me access to the rights of a share purchase of $1.10 ps and there is also the opportunity to apply for more shares over the number of rights held, so I will apply for another 4000 shares which are also available for $1.10 and it does not attract any brokerage of course. So I was able to realize a 134.70% gain from the combination of the renounceable rights and company sale and hopefully regain my holding of around $5000 of SMR again after I take up my rights and apply for the extra company shares.
 
Now to my portfolio which is looking a bit tragic with many of the stocks being pounded but still maintaining their levels above stop-loss although BNKS slid into stop-loss territory on a couple of occasions during the week but as I have said, my stops are always manual and there for me to assess how things are travelling. I noticed the US equivalent fund of BNKS which is KBE had an excellent volume spike at KBE's recent low. It has managed to shake off the market doldrums and moved slowly upward from there. Hoping BNKS will continue to follow suit.

Perhaps @Skate will be kind enough to make my portfolio look a little less tragic with his magic squares! :happy:

Doovie 11.3.22.png

A-black-cat-who-has-knocked-over-chess-pieces.jpg.optimal.jpg
 
Perhaps @Skate will be kind enough to make my portfolio look a little less tragic with his magic squares! :happy:

Watchlists
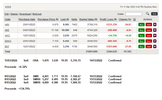
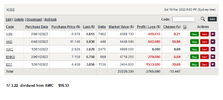
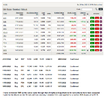
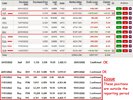
The watchlist capture below is a snapshot of the results of "open positions" that can be misleading. Using the "KISS Portfolio" rather than a "Watchlist" the results become clearer. The "Watchlist" reports a loss of -$3,294.02 (-15.185%) which is inaccurate & doesn't do the "KISS Strategy" justice.

The KISS Strategy Portfolio Results
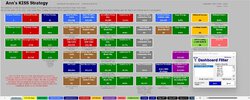
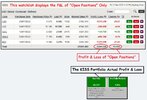
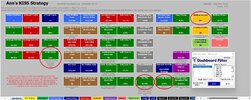
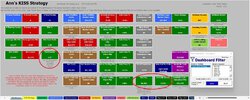
The (accurate) results are reflective of how the strategy is performing. The "Portfolio" reports a profit of +$4,777 (+9.6%) with 5 open positions. To understand the "Dashboard" click to expand & read the caption to better understand the results displayed. The colour coding of the boxes also tells a story at a glance.

Ann's KISS Strategy DASHBOARD.jpg


Buy Trades.jpg


Sold Trades.jpg


Open Summary.jpg


Open Positions.jpg

Summary
The KISS portfolio is traveling along nicely. The Buy & Sell Trades are listed for those interested & following along. The "Open Positions" are also listed even though Ann's has them displayed.

Skate.
 
Hi Ann, like what you are doing.
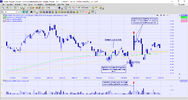
On the ORA chart you have a box "sell under $3.25". Is this your stop loss and, if so, how did you arrive at it it?
Cheers
 
Hi Ann, like what you are doing.
On the ORA chart you have a box "sell under $3.25". Is this your stop loss and, if so, how did you arrive at it it?
Cheers
Thanks for the question Bourseboy, I had been thinking about giving an explanation for how I arrive at my stop loss levels. I should emphasise these are all entirely manual stop losses. If this portfolio had auto stop loss I would have been closed out of four of the holdings unnecessarily with quite large capital losses. I like to see how things are travelling before I make a decision to leave a stock. Often there will be a spike down below stop loss for a day or two before it recovers again. In the case of CKF, as the markets were falling I moved the original stop of $11 up to $11.41, it rather hung around below stop loss looking a bit on the weak side for about four days. That was enough for me to flick it at a bit of a capital loss of around 7.6%. It may come back but the little capital I lost will not leave me too badly out of the money. So far it has continued to travel southward, I am not regretting the decision to sell.

ORA stop loss 14.3.22.png
 
Thanks for the explanation. I understand your reasoning wrt setting stop loss. Still have not found stop loss methodology that I am sure about. Currently thinking 2 ATR below buy price. Feel 3 ATR results in too big a loss (and comes in a little late, as trend by then is well established as going down). Not keen on %, but have not explored this yet.
 
Nothing sold this week but I decided to review BST as it looks really dreadful in the portfolio. It went ex-dividend on Monday and had a very small fall into the stop loss level for one day. When I bought this I was quite confident it would probably consolidate sideways before it began to rise after a month or two. As we all know now, we just went through the worst January on record for the markets and BST got well and truly sold down, probably by the original subscribers to the IPO. Although I have no doubt it was being sold down from its top intentionally. The fundies probably decided it had risen enough. I will show why I am so convinced about this.

This is just another example of how I am now going to adjust my entry-level. For years I have been rewarded quite handsomely by being a trend trader, entering after higher highs and higher lows to a point overcoming a support/resistance line. I did this by avoiding buying in on the months most likely to have a retrace. I have been profoundly grateful to have encountered this market correction so early in my new portfolio. It has made me look harder at entry levels. I originally started this thread in order to find a better exit strategy in an effort to improve on an average 20% gain in my trading. I can see how I may well be able to better my 20% average with a better entry strategy.

BST drawdown 18.3.22.png


On the day I bought into this there was a lot of buying support for the rise in price. Then came the price decision after close. No-one will ever convince me this is not manipulation of the markets!

BST 13.1.22 Final after hours.png
 
Hello @Skate may I ask for your very kind assistance to make my portfolio look slightly healthier than it appears please?

Ann's Kiss Strategy Logo.jpg

There is not too much to say as the results speak for themselves. I've circled in red a few highlights. The Kiss Strategy is traveling along nicely.


Ann's KISS Strategy DASHBOARD.jpg

Summary
The results are easy to summarise in one word "Impressive". A Profit Factor of 2.63 is simply "amazing" trading during these turbulent times.

Skate.
 

This is gorgeous, thank you very much Skate! And again thank you very much for going to so much trouble to make me look less of a loser! :)

The results are easy to summarise in one word "Impressive". A Profit Factor of 2.63 is simply "amazing" trading during these turbulent times.

Skate.

Really?! Thank you for the kind words, I was thinking the results were a bit average. My own takeaway was simply there is so much more that can be improved here for far, far better results.
 
Still have not found stop loss methodology that I am sure about.
a good start if you only use one method would be to use market structure
Hi @Bourseboy , my brief one dimensional answer gnawed away at me so I had to add to it by saying that your stop-loss method has to be integrated into your money-management method and your money-management method has to be integrated into your trade plan. So a stop-loss based on market structure may not be suitable for a particular trade plan. OK, now I can feel more relaxed about giving advice.
 
Hi @Bourseboy , my brief one dimensional answer gnawed away at me so I had to add to it by saying that your stop-loss method has to be integrated into your money-management method and your money-management method has to be integrated into your trade plan. So a stop-loss based on market structure may not be suitable for a particular trade plan. OK, now I can feel more relaxed about giving advice.
And you are not giving advice as per forum number 1 rule, you are offering suggestions of different potential ways to trade based on your experience ?
 
I have been banging on about market manipulation here and elsewhere and today I went in to check my holdings after the close and was gobsmacked at this! I would love someone to come on here and tell me this is not market manipulation 101.

As soon as I can get out of this bloody stock without copping too much capital loss if that is even going to be possible, I am out never ever to return. The price manipulation is just too blatant and regular.

BST total BS 22.3.22.png

and this is a shot of its price journey through the day

BST daily trade 22.3.22.png
 
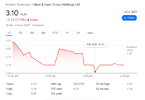
....and another exciting or should I say exiting week of trading for KISS. BST held below its stop loss level for three days, on the third day I said enough is enough and sold. Damn painful $$ wise too! The only time I ever lose big is when I break my own rules...I should have known never to break my own rules they are there for a reason! These were my own words when I added BST here...
The other stock I bought is actually a rule breaker for me. It is only a tiny baby on the charts which still is not old enough for a 200dsm these I would normally never buy.
Now I ask myself a question ... "have you lost enough money to imprint this rule into your numbnut yet?" then I answer myself, "Only buy a stock which is old enough to display the 200dsimple MA!" Geez. Now I have got it!

Just for academic interest, I went back and looked at the 11th stock I bought at the time which would have been on my original list had I not bought BST. It was LOV. Here is the chart and here are the results...Fortunately, I was practising reading volume spikes at the time in an effort to predict future stock movements. I was happy enough with proceeds of 14% in a falling market.

LOV exit 25.3.22.png
 
I might be being an optimist but I feel the markets may have done their retrace for the time being so I am going to say out of 10 stocks I lost on two which is about my average 10% to 20% loss rate. I really need to work on this further. Breaking my own rules is often the cause of a loss.

In order to keep this thread interesting, I decided to top up the holdings back to ten again. I do hope @Skate does not mind all the extra work!

I have reinstated SMR because I had no intention of selling this out of my portfolio, I was simply swapping my holding for a lower buy price of $1.10 instead of $1.18, I think I paid for it originally. They put up a notice to say we all got our full allocation, so now safe to add it back to the list of holdings. The new shares begin trading on the 1st April, so there may be a fallback in the price. AGE is in a trading halt waiting for some drilling results, so I may need my stop loss levels for this one!

I have now adjusted my trading entrance style from buying after higher highs and higher lows, to a simpler entrance of buying on or just above the 200dmas. My stop loss level will still remain a touch under the 200dmas where I find a price support level. This is pretty much always been my habit of stop loss and as I have mentioned all my stop loss levels are manual. Let's see how this new style works for me as I go forward with my new volume spikes in hand as well! All these new stocks have been bought using this new style and I believe all the charts are displayed under their respective threads if anyone wishes to assess them at all.

I should also add all the stocks purchased here were found on the IC screener.

Again thanks so much to @Skate for all the effort he is putting into keeping a more professional record of my comings and goings, it is profoundly appreciated! hearts.gif

doovie 25.3.22.png

shonegolds wisdoms.jpg
 
I have reinstated SMR because I had no intention of selling this out of my portfolio, I was simply swapping my holding for a lower buy price of $1.10 instead of $1.18, I think I paid for it originally.

Ann's Kiss Strategy Logo.jpg

@Ann I have an issue.

Movements outside the last trading week can't be added to the portfolio
The additional positions highlighted in red reflect the movement of positions outside of the reporting period. For accuracy, the movement of positions has to be from the last recorded date of 20th March 2022. The updated report can only include "movements during the previous trading week" between the 20th March to 25th March 2022. The movement of positions outside this period has "not been recorded" as the movement "falls outside the cascading time period". (the last trading week)

Ann's KISS Strategy.jpg


Open Summary before today's report
The report below is the "Open Positions" from last week. The movement of positions can only be from the last report date of the 20th March 2022.

Open Summary.jpg

What does this mean?
The movement of the positions below falls outside the "last reporting" period so they can't be included.

To be included in the Portfolio
The movement of these positions must have been between 20th March to 25th March 2022. The positions reported below should have been included at the "record date".
(1) SMR (14/3/2022)
(2) DYL (15/3/2022)
(3) PDN (15/3/2022)
(4) AGE (15/3/2022)
(5) PEN (15/3/2022)
(6) DYL (14/3/2022)


Ann's KISS Strategy DASHBOARD.jpg


In a nutshell
A "Profit Factor" of (3.47) & a "Portfolio Return" of (12.9%) is impressive.

Summary
Reporting & recording the movement of positions outside the last report date "muddy the waters" as to say. Adding additional position movements contaminates the accuracy of my reports so in all fairness it would be better for me to refrain from making additional posts on the KISS Strategy.

Skate.
 
@Skate why is DEV in and the rest out I bought the rest before DEV. I think you are looking at the settlement date and not the purchase date...very confused!
 
Top