Australian (ASX) Stock Market Forum

KISS Trading with Ann

Agree. I've read other analysis along those lines. And, there's some stats about investing at the top of the market before a crash and you redeem your money in X amount of time if you just hold on. As long everything you'd invested in didn't go bankrupt, so it might depend a bit on your asset allocation and time horizon.
Yeah no! I have a high threshold for pain but riding all the way down to the bottom is not my ideal business plan! :D
 
Loving your new avi Sean! ?

I never use other people's guides, I have always only ever eyeballed it. I look at something and go, yeah near enough!
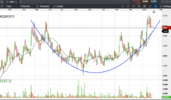
However, being only half a cup I am not sure I can claim it to be one nor am I confident it will resolve as a Cup & Handle.

Dahab, diving with the fishes, 2005, pre-ASF! I'm not sure why more people don't put their true selves up. I've only done it since I retired I suppose. And, I'm trying not to say crazy crap that will bite me later.

The chart I've pulled up actually looks like the C&H is yet to conclude, perhaps. Very different to yours. Very nice large rounded bottom, but not sure what that means from here. Would have loved to see this a few months ago.

In the right industry at the moment. I do like LEDs. Just wondering if they're all talk or have some substance.

Screen Shot 2022-01-23 at 3.36.13 pm.png
 
Dahab, diving with the fishes, 2005. I'm not sure why more people don't put their true selves up.

View attachment 136411
Well I am sure we would all put pics of ourselves up if we had a head as good looking as yours.

Life__s_Little_Pleasures_by_ShoneGold.gifThis was an avi I drew and animated of myself when I was the Gallery Director for pixel art on DeviantArt! I don't smoke but it sort of added that tired old tart look to me!


I see your 'cup' as the 'handle' and don't expect a really deep retrace, handles tend to take off once they are clear of the horizontal overhead.
 
I see your 'cup' as the 'handle' and don't expect a really deep retrace, handles tend to take off once they are clear of the horizontal overhead.

So, between 64-70c is the handle? It actually looks like a very nice setup if it bounces off 64 ish.
 
I thought I would take this opportunity to show how I make trading decisions in a falling market or just exiting stocks in general. Sadly all my KISS stocks are recent purchases so therefore I have no buffer of time in and a price paid. However, this does not mean I will behave like a deer in the headlights, even if it causes me some losses, even substantial losses. I assess each stock for its price in time and space taking care to note the quantity of overhead resistance be it falling or horizontal overhead resistance or/and the 200dsma. This is the first time I have been caught on the wrong side of so many trades. January is generally a fairly safe month to trade and it can often have some decent upside. Not always but sometimes. Let's see how we go.

All my trades are based on levels of support or weakness, once I feel a stock has too much overhead pressure to recover for some time, I call it a day. Hope you find this interesting.

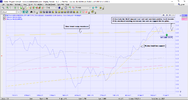
AKE sell level 26.1.22.png

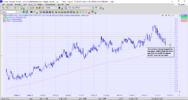
AWC sell level 26.1.22.png

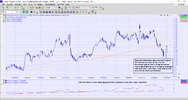
ABB sell level 26.1.22.png
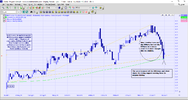
CKF 26.1.22.png

There are a number of other items in the KISS list but it is pretty much the same scenario with some of them.

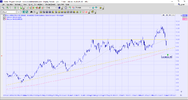
However, this last one is the reason I am here with the KISS thread. I wanted to improve my exits from a profitable stock. Having had a long term view of stocks in the past, I would just ride the highs and lows. I felt I could improve my results on a better exit strategy and then potential re-entry if the stock returned to higher levels. This is my strategy of using a short term rising trendline support, once this is broken I will then draw a support line under the first low beyond the trendline as I have illustrated on the chart.


OOO sell level.png
 
So will you exit everything if the market keeps falling, or hold some with a long term view?
me ??

i am mostly likely to hold ( or even selectively accumulate )

my top ten at the end of last month

( by $value )


1. MQG. ( 'free-carried ') ( av. SP $26.76 , but ignoring the crystallized gains from the SYD bonus )

2. PME ( 'free-carried ' ) ( av. SP 16.5 cents )

3. APE ( at some cash risk ) ( av. SP under $2.50 )

4. API ( full cash risk ) ( less than $100 behind ) ( av. SP $1.34 but likely to be acquired by WES )

cash ( boosted by take-over payouts )

5. WES ( at full cash risk ) ( av. SP $37.13 but ignoring the bonus COL )

6. JHG ( full cash risk ) ( av. SP $29.17 )

7. BHP ( some profit taken ) ( av. SP $28.96 , ignoring the bonus S32 )

8. CMW ( at full cash risk ) ( less than $400 behind ) ( av. SP 90c but willing to carefully accumulate )

9. GRR ( at full cash risk ) ( av. SP 20.3 cents )

10. CDM ( at full cash risk ) ( av. SP 98 cents but willing to carefully accumulate )

SO FAR the plan is to cherry-pick/accumulate

BTW i do NOT expect this to be a calm sensible time coming ( seat-belts and hard hats recommended even if watching with binoculars )

but if you are say 40 years old , other options might make better sense ( for you )
 
I was mainly asking @Ann the question, she has been showing the suggested exit points, I was wondering if she applies the same rules to all her holdings or just certain ones she trades.
I as you @divs4ever seem to be a buy and hold for a lot of shares and trade a smaller group of speculative ones, I may be wrong but that is what your posts seem to indicate to me.
By the way thanks to you both, for sharing your ideas.
 
So will you exit everything if the market keeps falling, or hold some with a long term view?
When the markets are in the decline there is no long term view for me. There are stocks I like and will re-enter after a fall or a break in the 'sell' level after they come back above some designated support line.
I was mainly asking @Ann the question, she has been showing the suggested exit points, I was wondering if she applies the same rules to all her holdings or just certain ones she trades.
Yes, in the past I always had an exit strategy at that 'sell' level but this is what I am trying to improve with the KISS thread. Riding it down to the 'sell' level has seen me give back big percentages to the market in the past. I rarely lost capital, except for a rare exception and that was generally because I broke my rules.

I took the opportunity to sell CQE on Friday. The normal support level I would give to CQE would have been $3.33 as my 'sell under' level. I would have got something a little under 10%, not including brokerage, not awful but not good either. Selling when I did pulled in approx 23.88% including brokerage. I could have sold higher but it had broken above its all-time high and a fall back to short term support seemed reasonable. Once it broke that support for a second day was enough to get me out particularly reviewing the other major REITs such as MVA, REIT and SLF. They are all spearing through their 200dsma. Outski baby! I can always buy back in if it breaks above the level of the double top.

CQE sold 28.1.22.png


28/01/2022 Sell CQE
1,666​
3.730​
19.95​
6,194.23
1/02/2022 Confirmed
 
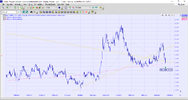
So far none of my shares has sustained a fall below their sell lines so nothing was needed to be sold as yet. CKF spent a day and a half under the $11 sell line but given that it has a positive PVI which tells me there is market sentiment and looking at the punters lined up in the quote section on the day, there was almost two to one buyers to sellers. So demand is there, I waited and sure enough, it hopped back above the $11 sell line. Now I am going to raise that sell line to $12ish waiting to see if the now rising resistance can be overcome to reinstate it as a support line.

CKF $12 resistance 28.1.22.png

Now let's take a look at the worst-performing stock for the week in my KISS portfolio, poor little BST, it is down 21.14%! Dear, oh dear!

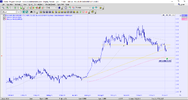
I discovered this week if you set the 200dma on exponential not simple it will work with very young stocks. I have been very reticent to buy youngsters as I had no idea how they were travelling in space without a 200dma, now I can see using the 200dema. I can see I bought this at the top of a dreadful bubble and I am not at all surprised at how much it has fallen. Pleased to see it bounced off the 200dema and lifted above the rising support from its listing. It will be interesting to see if this is a slow recovery or will it bounce back quickly. It may sit in minus for some time, that's OK, my fault for buying at the top of a bubble!

BST 28.1.22 200ema.png
 
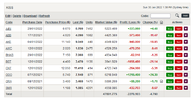
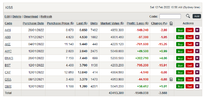
Now we see what the turmoil of this last week has done to my KISS holdings, not a pretty sight but fortunately, none had to be sold as they all held their support lines, some by the skin of their teeth. There may be more dramas in the markets ahead and there is still the risk I may have to sell and realize a loss, time will tell.

Doovie 28.1.22.png
grumpy kitty.jpg
 
Now let's take a look at the worst-performing stock for the week in my KISS portfolio, poor little BST, it is down 21.14%! Dear, oh dear!

I discovered this week if you set the 200dma on exponential not simple it will work with very young stocks. I have been very reticent to buy youngsters as I had no idea how they were travelling in space without a 200dma, now I can see using the 200dema. I can see I bought this at the top of a dreadful bubble and I am not at all surprised at how much it has fallen. Pleased to see it bounced off the 200dema and lifted above the rising support from its listing. It will be interesting to see if this is a slow recovery or will it bounce back quickly. It may sit in minus for some time, that's OK, my fault for buying at the top of a bubble!

BST 28.1.22 200ema.png


Hi Ann,

Just making sure that you don't get confused between a 200 bar exponential moving average (ema) and a 200 bar Dema as they are calculated differently.

Cheers, Rob
 
I took the opportunity to sell CQE on Friday. The normal support level I would give to CQE would have been $3.33 as my 'sell under' level. I would have got something a little under 10%, not including brokerage, not awful but not good either.
Rubbish, rubbish, rubbish! Taking another look at CQE my 'sell under' level would have been $3.57 not $3.33. Although now that I look at this chart I really gave a lot back to the market even selling at $3.73. I need to get a lot better at this. I think I need to bring in some simple indicators such as the RSI and actually look at them at a high point, the risk is I end up behaving like almost a day trader....need to ponder on this.

CQE sell line 28.1.22.png
 
Hi Ann,

Just making sure that you don't get confused between a 200 bar exponential moving average (ema) and a 200 bar Dema as they are calculated differently.

Cheers, Rob
Hi Rob,

Dunno, I just trust Colin Twiggs to suggest the settings, I don't do calculations myself....

This is how I choose my indicators, I mostly use Colin's suggestions as they come. Although as I say to people if the MA of whatever time or style works for you then use it! So it really doesn't matter what it is as long as I feel comfy using it.

Indicator board.png
 
Rightio, let's see what eff ups I did this week! OOO for one!

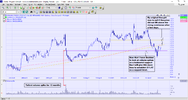
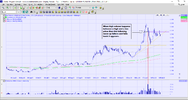
First, let's talk about CKF, last week I wrote on the chart that if it did not lift above $12ish after a few sessions then I would sell because I felt it would be weakening. Well since then I have discovered Volume Spikes, a much ignored and disregarded indicator by me. I started looking for the tallest spikes of volume and drew a horizontal line from the EOD price. I now see them as a solid line of support with the strength of numbers behind them. Sort of a horizontal volume level if you will, there is a proper name for this but I can't remember @peter2 knows what it is called. I have drawn a volume horizontal on the CKF chart at $11.47, let's see if the price can remain above this line.

CKF 4.2.22 Vol Spike.png

Now to OOO. I normally only look at charts but I thought I would be a clever clogs and try to sell at the top using the rounding top I could see on the oil chart (WTI not OOO) and also look at the MACD and the RSI seeing them into oversold. Sold didn't I?! I was done like an old bear hunting for honey.

I have now done away with the RSI, MACD and a few others. I have kept Twiggs Money Flow, Positive Volume Index and Volume. Just looking at those couple of Indicators it looks really positive and certainly worth a buy, which I may well do this coming week. Sometimes I wish I could just get out of my own way! ?
OOO bear trap 6.2.22.png
 
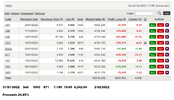
Nothing was sold this week, all within their tolerance levels, they are still looking a bit ordinary. Had quite a bit of green early in the week but Friday's drop stuffed that. Lots of tempting stocks out there, busy going through my watch lists.

Doovie 11.2.22.png

Thinking.jpg
 
Hmmm
15% losses and 5% wins .
Gotta take care of this Ann.
It is fine so far John, most of them are well above the sell line, but I do have my sell prices organized in case something decides to weaken. None of them looks weak just offering up buying opportunities for those more patient than myself. Some of these I bought too high. I am hoping a bit more study of volume may give me a better view of entrances. More practice is required. I have in the past entered purely on chart shape but now I know often a stock will be at a high with high volume before a pullback and vice versa. That will indicate a possible fall or rise in the immediate future. I also notice if there is a high volume in the middle between high and low then the rise is not sustained. I noticed this when I was getting up close and personal when I first started looking at volumes. I was looking at the charts of the Competition for Feb. It was WIN which showed me the high volume high, pull back and the high volume low, lift in price and it was LPI which showed me the restricted rise after a high volume in the middle. I have taken note of this and have found it to be true elsewhere as well. Too hard to describe...picture.

LPI 11.2.22 fall back vol.png
 
Top