Australian (ASX) Stock Market Forum

KISS Trading with Ann

What is the point of posting a chart with a lot of lines on it if you have not labeled the lines. How can anyone get any benefit from this information without knowing what the lines represent. It's difficult to see where the ship is heading when it's in stormy weather.
Some are impressed with what seems to be complexity.
Reality is that there are just a few indicators like Bollinger, Various Parabolic SAR
and Resistance along with an RSI and the odd trend line.. All with no real predictive,
Anticipatory value, particularly in a range.
 
Goodness me, I had no idea all these discussions taking place down here until I came to put up my weekly progress. Sorry Captain, I was not ignoring you!

P2 is asking for challengers\
Do you want me to help you?
IN REAL TIME!
LOL

Very kind of you my beloved Captain but I am my own challenger, I am competing with myself. I never compete with the next person as that might limit my progress by comparison.

Ahoy there 1st Officer Ann
Please check out the MQR sail

Do you have her below deck
If so?
Hoist her at DAWN
If you know what's good for you?

That's annoying, I found MQR ages ago while it was travelling too high from the 200dma. Somehow I didn't add it to my Lithium list even though I had its details written on the chart. Never mind, let's see how INF travels. I think I only want two lithiums in my portfolio here as I am only going to hold 10 stocks for this exercise. I may add MQR to my main portfolio. Thanks for the heads up! However let's see how things go this next week, it may be a bit rough on the high seas. I may be able to buy in cheaper.

What is the point of posting a chart with a lot of lines on it if you have not labeled the lines. How can anyone get any benefit from this information without knowing what the lines represent. It's difficult to see where the ship is heading when it's in stormy weather.

I think the benefit is entirely for the Captain and myself, I can read between the lines! He has arrived at a place over the years, with indicators that speak to him. Charting is an art, no artist uses the same style. I am sure the Captain won't mind me saying he uses amongst other things Parabolic SAR, trailing stops, Keltner Channels, 200dsma plus a few more which is for the good Captain to know.


Some are impressed with what seems to be complexity.
Reality is that there are just a few indicators like Bollinger, Various Parabolic SAR
and Resistance along with an RSI and the odd trend line.. All with no real predictive,
Anticipatory value, particularly in a range.

Some people have great foresight with what they can see on charts whether it be through a forest of decoration or the simplest hand-drawn lines. Perhaps your charts as you use them are not predictive for you John but for others, they can speak of what will happen in the future, sometimes years ahead. It is not a science but it is an art.
 
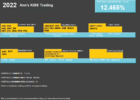
Well, there was some real damage to some of my stocks. AWC is sitting in the stop-loss zone, my uranium stocks look a lot worse for wear. I sold PDN on Thursday in preparation for buying it back at a cheaper price with the share purchase plan, glad I did as it would now be in the red by about 3.25%. I need to make the decision, do I apply for the SPP or wait and see if I can get it better than 72c if the markets continue to puke? I have to buy in by Tuesday to be eligible for the SPP.

PORTFOLIO TRACKER 22.4.22.png

Doovie 22.4.22.png

Some are impressed with what seems to be complexity.
Reality is that there are just a few indicators like Bollinger, Various Parabolic SAR
and Resistance along with an RSI and the odd trend line.. All with no real predictive,
Anticipatory value, particularly in a range.
Being dyslexic I need to read and re-read things over and over to get a true meaning. I responded to tech/a's comment on the previous post but then I read it again, thinking I had misinterpreted it. I hadn't but his words rang a bell for me.

For me reading charts could not be classed as predictive as that is saying something is going to happen. No, I can't say something will happen but I feel with all confidence after reading my charts I can anticipate what may happen.

So therefore, chart reading by an experienced and competent chartist may well be anticipatory of future outcomes.

I would strongly encourage everyone to work on chart reading, just download a free version of IC charts and play with them, I played with them for over a year back in about 2002, just learning and seeing patterns repeat and repeat, drawing lines and playing with all the indicators to see if anything could be seen. I wasn't taught by anyone, I just created my own style of what I could see. Later I learned party tricks like what was a pump and dump and how to calculate a swing trade from the genius chartists who used to frequent the now-defunct IC forums.

Perhaps like Tech/a you may never be able to read enough into a chart to give you any anticipation as to its future direction but some out there may well be able to learn the art of the chart.
 
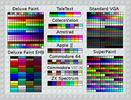
This chart looks like a video game on a Commodore 64 from the 80s. Except it's in colour.
I need to take issue with you Sean, as a past PixelArt gallery director for DeviantArt, I need to tell you Commodore 64 had a limited colour pallet of 14 plus B&W colours it was not just black and white. Used by talented artists they could create a pallet that appeared to have far more colours than were seen.

retrograde_palettes_by_arvin61r58-d63xvub.png
 
I need to take issue with you Sean, as a past PixelArt gallery director for DeviantArt, I need to tell you Commodore 64 had a limited colour pallet of 14 plus B&W colours it was not just black and white. Used by talented artists they could create a pallet that appeared to have far more colours than were seen.

View attachment 140752

Maybe it was a Vic 20 that I recall.
 
Looks like I have been Buried in the Back Pages again

Please go to" Storm at Sea"
Officer Rederob has pointed out a few typo's there but I'll fix them up by Monday
However
"The charts are Indisputable"XYZ Yacht.GIF
 
Looks like I have been Buried in the Back Pages again

Please go to" Storm at Sea"
Pity it was berthed in Chat. I think a lot of people have Chat on ignore, myself included. Perhaps you could have berthed in Private ASF members forum, it can be moved if you would so desire. Much classier than Chat and more appropriate.

My goodness, you have done an enormous amount of work with "Storm at Sea" and a grand yarn it is! As your loyal first mate if feel it is beholden on me to comment with some chart examples of my feelings about the coming storm and anticipate how some may fare.

This may be a rollicking great Thread and I am really looking forward to its passage, not to worry about typos! party0016.gif


Ahh dear, it is so much more fun when the markets are going up. Bought a new one but no sales.

My little portfolio here seemed a bit heavy with Uranium stocks, so as I sold PDN last week in preparation to buying it back this week through a company SPP for 72c, which I did, I decided to take the opportunity to add a new stock and not put PDN back into KISS even with its new and improved percentage increase. I am trying to get a bit of new blood into KISS, just for interest's sake.

All my stocks, whilst dropping, didn't drop below the 200dma and were well away from their stop loss, so absolutely no reason to ditch any of them with the exception of AWC which was in trouble last week. Why haven't I sold? It appears Aluminium may bounce back up from the 200dma, I am thinking our market may well continue upward, could be quite wrong but let's see.

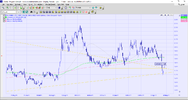
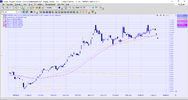
The chart of AWC also gives me a sense it will return back to higher levels. It bounced back above a long term rising support line, it has lifted back above its long term falling trendline and there appears a bit of a spring in its step, could all come crashing down of course, but I will leave it for another week and see how it is travelling.

AWC stoploss29.4.22.png

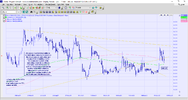
As to the new one, it was doing OK until Friday when it had a fall and put me into the red but I wanted another coaler in my portfolio and decided to add it to KISS for fun. It is still fine, it dropped below the 200dsma but is still riding the 200dema and is also still above the stop loss level. Ignore the writing on the chart they are just notes for myself, most charts of mine have stuff scribbled on them, it is my lip service to fundamentals.

AHQ

ahq buy 29.4.22.png
 
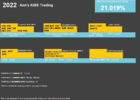
Having never run a trading portfolio on a forum before I may not have set it up for a true picture by limiting it to a number of stocks. Perhaps I should have just limited it to the $50,000 starting figure. That would have been simpler, never mind I am not going to mess with it but I will show you the two stocks I intentionally sold to buy back and that is SMR and PDN but have since dropped from the KISS portfolio. SMR was bought back at 1.10 but I didn't get my full allotment. I got 3222 at 1.10 and have since added to the holding by an extra $5000 which itself is up 20% on its own not including the 3222.

Here is a little kiss plus doovie with how the original SMR and PDN are travelling to date. Of course, I am not adding it to my percentage increase for this week which is looking quite miserable! kiss plus.png

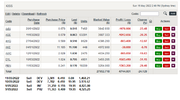
Now to the real Doovie which was actually in minus from this week's retrace.

Doovie 29.4.22.png
PORTFOLIO TRACKER 29.4.22.png
 
On my newsfeed I get Zero Hedge which I find hard to take with dubious facts most of the time but occasionally he will quote from other business sites that can be very interesting. Today he had a very interesting link related to being a successful trader. I am always a sucker for articles like that, I am forever on the lookout for something which may improve my game. For want of a better place and because I want to find it again easily I will plonk it here, off topic but meh, my thread, my rules!

Being A Successful Trader Is A Paradox

The trading aspect starts after the hospital observation.
 
What do they say? "Sell in May, go away". So far I have not sold any of my stocks.

When the markets get dodgy I have some points on charts that say "leave". Never one to outstay my welcome I watch for these signals. I am now seeing these signals.

The first one is the gapping down below the 200dma of the weekly Copper price chart. All things electrical need copper, copper is telling me it may not be needed for a while. This will cause a flow-on for all the other commodities associated with electrical products, retailers and a host of related goods and services.

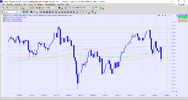
The second one is the good old All Ordinaries. It has hit its head three times against its all-time high and failed, it has now fallen below a short term rising support line, it has struggled to rise above the 200dsma and has fallen below the 200dema three times. It is getting weaker and failing.

I intend to make an orderly exit of my entire stock holdings this coming week. I am certainly going to crystalize some losses, far more than I normally experience but that is fine as overall I am well up this year. This is my normal practice to sell my entire holding at a given signal, remain still and watch what happens, what sectors are braving the fall what stocks or rather groups of stocks are rising. I never assume or try to guess what will or will not rise, I wait for my charts to tell me. I have protected my capital and gains like this for the last 20 years. If I am wrong it is as easy as pie to buy back in. This is not a recommendation for others to leave the market. I am relatively conservative but for the more aggressive amongst us then fight on boys and good luck!

COPPER weekly
copper weekly gap down 6.5.22.png

ALL ORDINARIES daily

$XAO out 6.5.22.png
 
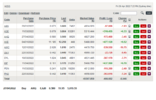
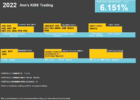
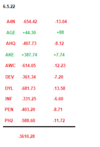
For some reason the Doovie from the bank is not working, none of my watch lists are displaying which is a real pain. I have done my best to compensate by copy-pasting from my main portfolio list. Should be fine. I have double-checked the figures. Not a pretty sight this week but I know I am not alone.

PORTFOLIO TRACKER 6.5.22.png

doovie not 6.4.22.png
 
Sorry you didn't get an update on the weekend, I have been a bit under the weather. The thought of doing maths is the last thing I can cope with at the moment.

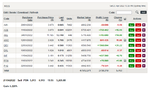
Here is the Doovie from last Friday, not a pretty picture but no percentage portfolio, so it looks worse than it is. As I mentioned everything is up for sale, will I get my asking price, who knows? For anyone interested I have all my holdings on sale at their closing price of Friday May 6th.

I am convinced the markets are about to collapse and hope I will have enough time to exit without too much bloodshed.


Doovie 13.5.22.png
However, maybe not so I think I will close with a song!

 
Top