Australian (ASX) Stock Market Forum

KISS Trading with Ann

@Skate why is DEV in and the rest out I bought the rest before DEV. I think you are looking at the settlement date and not the purchase date...very confused!

@Ann that's the issue. You purchased all the positions listed before (DEV). To have those positions included in the portfolio they should have been reported before the last report & at the time they were actioned. (ie, the "Record Date)

To be included in the Portfolio
The movement of any positions must be been between 20th March to 25th March 2022. Last week's report closed on the "20th March 2022" & this week's report closed today "27th March 2022".

Any additions or deductions to today's records
These movements can only be from movements from tomorrow to the end of trade Friday (28th March to the 1st April 2022 inclusive)

DEV falls within the last trading period
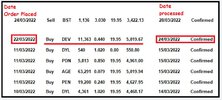
It appears the buy order for (DEV) was placed on 22nd March 2022 & the purchase was confirmed/transacted on the 24th March 2022 (within the last trading week).

DEV purchase-Transaction date.jpg

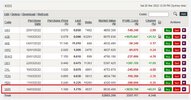
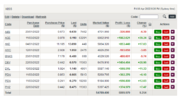
Why are the positions below excluded?
For the simple reason that the movement of these positions must have been between "20th March to 25th March 2022". The movement of all these positions occurred before the last report. I'm just saying "you should have reported them during the correct time period".

Transactions have not been reported correctly
The records below should have been reported during the week of the "14th March 2022 to 18th March 2022". The positions should have been reported & included at the "record date" for the week they were actioned.

(1) SMR (14/3/2022)
(2) DYL (15/3/2022)
(3) PDN (15/3/2022)
(4) AGE (15/3/2022)
(5) PEN (15/3/2022)
(6) DYL (14/3/2022)
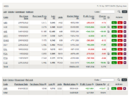
Recent.jpg


Summary
(DEV) is applicable to this week's report as the transaction date falls within the last trading period. You can't place buy & sell positions "before the last report", otherwise, that's fudging. I hope this clears up the confusion.

Skate.
 
Darn silly me, here I was thinking you could just pump in the figures and get an answer.
 
Darn silly me, here I was thinking you could just pump in the figures and get an answer.

My question
Why didn't you report the transaction during the relevant period?

plus trading on SMR hasn't started for me yet anyway.

Also "SMR hasn't started for me yet" - What do you mean by this comment?
You have listed (SMR) in your watchlist as being purchased. Correct me if I'm wrong. Doing what you have done compromises the accuracy of the reports & the relevance of the thread.

PLEASE NOTE: You have placed (SMR) in your watchlist already
You can place any trade at any time & get a result but that's not how Portfolio Management works.

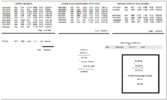
SMR Comment.jpg

Skate.
 
My question
Why didn't you report the transaction during the relevant period?
I decided after selling BST it was going to be a somewhat boring thread with simply four stocks to watch, so I just added the next lot of shares I bought using the new style of trading. This was interesting to me to see how I went. I am interested to see if it improves my bottom line. This whole thread was just for my benefit but all are welcome to peek in and see how it is all travelling of course.

You have listed (SMR) in your watchlist as being purchased. Correct me if I'm wrong. Doing what you have done compromises the accuracy of the reports & the relevance of the thread.
I BPAYed Stanmore on the 14.3.22 for the value of the shares I was applying for. It was not until 25.3.22 they confirmed they would be accepting all offers for new shares. So on the 25.3.22 they published confirmation all applications were successful which meant I was holding $4990.70 worth of shares at $1.10. However, those new shares will not start trading until 1.4.22. As far as I was concerned I owned them, bought and paid for but simply would not be able to sell them until they are released for trading on the 1st of April. As I was not intending to sell them it is a moot point!

PLEASE NOTE: You have placed (SMR) in your watchlist already
You can place any trade at any time & get a result but that's not how Portfolio Management works.
Ahh right! So in other words my portfolio and its results are purely a mirage if it does not agree with a computer program?
Got it! wink-good.gif

Well, I really appreciate the trouble you have gone to Skate, it has inspired me to actually want to see how I am going as opposed to just chucking it all into the accountant's hands at the end of the year and letting him sort it out. It is really just the trading that appeals to me, if I am honest.

Get's out old bakelite adding machine, drags out ancient, dog-eared, watermarked writing pad, licks the point of a lead pencil, has a psychological meltdown because it is arithmetic and begins to work out how the bloody portfolio is going.

Don't wait up folks this is going to take me hours, 35% out of 100% was my very best maths score.

calculator.png
 
Well folks, you won't be seeing my calcs tonight, I totally stuffed it up by missing the proceeds from one of the sales...grrrr! I need to make an angry face emote but my brain has crumbled inside my cranium so not tonight!
 
OK I really need help with this. I shouldn't be trying to do this after midnight. I cannot possibly have a Portfolio percentage increase of 20.17%. I haven't even started to really trade yet after the downturn. I have clearly stuffed something up. All the figures are there. Just can't find my mistake, it will be easy and glaring I know!

Edit: I am already seeing a problem. It is the Doovie, I put the buy price in without the brokerage. I will fix it tomorrow.

portfolio 25 .3.22.png
 
Last edited:
Not a huge difference once the brokerage was added. But there is a substantial difference for the total of my holding on the Doovie to what I calculated in my additions. 52,883.20 as opposed to 49,705.64

doovie 25.3.22 with brokerage.png.206
 
OK folks, I have gone over this and over it. I re-did the figures from the doovie and it only reduced it by a tad. It does look like my portfolio is up by 19.85% as at w/e 25.3.22. That figure is including SMR which will begin trading on the 1st April for the new issues.

Anyway, I have created a you-beaut table for the figure work. I can see it will be reasonably simple to keep it going after this first bit of work to set it up. I have a feeling there may be a bit of a dip in my holdings next week, so we will see how we are travelling. I will keep the new table until next week.

.....again, thanks very much to @Skate for all your kindness over the last few weeks with his program I am sorry I managed to confound your program!
 
OK I really need help with this. I shouldn't be trying to do this after midnight. I cannot possibly have a Portfolio percentage increase of 20.17%. I haven't even started to really trade yet after the downturn. I have clearly stuffed something up. All the figures are there. Just can't find my mistake, it will be easy and glaring I know!

Edit: I am already seeing a problem. It is the Doovie, I put the buy price in without the brokerage. I will fix it tomorrow.

View attachment 139569
@Ann in my stock portfolio spreadsheet/s, I have three s/broking columns, one is the actual s/broker fee, the 2nd is the GST component of that fee and the 3rd is the total s/broking fee (Fee + GST = Total s/broking). This total is then added to the total purchase cost of the stock bought.
I know it seems it don't need the GST to be separate but I like to have it there for completeness plus, I can see have much the govt. is extruded from my stock plays. :dead:

I do the same for the disposal side of the equation.

FWIW, if I have a DRP, SPP or some such, I really like seeing nothing entered into the s/broking columns. :cool:

Thanks too for posting up your KISS, really like it, onya!

Thank you so much Craton for taking the time to share the way you organise your portfolio, your accountancy skills are admirable. I have to admit that reading your instructions broke my brain! smile1.gif

I am going to keep my reporting as simple as possible with a starting point, stuff that happened along the way and how it looks currently, including brokerage and affiliated costs. The rest I will leave up to my accountant who gets paid big dollars in an effort not to cause myself any further brain damage from attempting maths.

Now to further problems I have caused myself with my disabilities, in this case, dyslexia. When I was reading the instruction booklet from Stanmore Coal regarding the renounceable rights issue. I read it to say if you take up your rights you can request more new shares at the same $ price as the rights price. Noooo that is not what it said. What it really said was if you take up all your rights you can request more new shares at the same $ price as the rights price. So I would have had to take up the 9000 odd rights first, then you can ask for more shares after that. Meh, whatever.

So the upshot was I got 537 shares at $1.10 and the balance of the money I paid was shares issued as at the open on Thursday, this last bit I am guessing. So instead of 4537 shares at $1.10 I got 3222 at an average of $1.548. Not such a windfall after all and I am thinking about topping up my holdings if the price falls down closer to the 200ma at some later time. Because there is going to be a bit of potential complication from SMR I have decided to leave it as sold in my portfolio and replace it with the next stock I bought PH2 (already charted on its own thread) which was bought on the same day as DEV. There is virtually no difference in the percentage increase from PH2 to SMR on Friday so I am not attempting to increase my percentage gain with the choice.

Like all my recent purchases I am finding them all in stock screens on IC including PH2.

Here is my new results screen, hope it makes sense, if not let me know and I will tweak it.

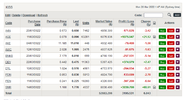
PORTFOLIO TRACKER 1.4.22.png

...and the Doovie which I decided is probably called a portfolio tracker but will remain being called Doovie plus I have added the performance comparison for SMR and PH2 just for the heck of it.

doovie1.4.22.png

As a final note, there will be no more pictures of pussy cats for the time being and two platitudes were more than enough for me, any more and I think I would hurl!
 
Cheers Ann,
Thing is, keeping track of Buys, Sells, DRP, SPP, Rights Issues etc, etc and then the CGT at tax time, now that's the real head scrambler, lol...

Thus to ease the burden, having well complied spreadsheets aka records is vital.
I primarily use two for the tax tracking.

One is the portfolio holdings spreadsheet that I have bought and sold. This is essential for long time holdings especially for Capital Returns and the re-calculation of the cost base.
I'm considering moving to a spreadsheet for each stock.

The other is for annual Div's where I track the franking/unfranked and any residual left over Div payment that wasn't applied to DRP for a particular stock.
E.g. Div = $100, DRP = $9.00 per share = 11 new shares and about 11c residual carried forward and added to the next DRP.

Of course with Excel, I can get fancy and have charts etc tracking performance for each stock and across the portfolio. Just basic stuff really as I'm not a trader per se.
 
Thing is, keeping track of Buys, Sells, DRP, SPP, Rights Issues etc, etc and then the CGT at tax time, now that's the real head scrambler, lol...

We are actually talking about two different things here. I started this thread with the philosophy of a basic and simple thread to demonstrate a bit of trading of how I buy and how I sell simply looking to improve my broad, end result with better trading. You are talking about a total and complete accountancy portfolio management demonstration. This was never my intention as it would become incredibly complicated and pedantic and would simply be a personal chore I could never countenance.

What I wanted for this thread was best described in my first platitude Simplicity boils down into two steps, identify the essential, eliminate the rest.

I gave myself a real budget of $50,000 for this thread. I bought 10 stocks averaging $5000 per stock including brokerage.
Along the way I sold 6 stocks and one set of rights, then I bought 6 stocks, had an increase from these activities added that, then I added any divs I received (not taking into account f credits). Then I added the weekly increase/decrease as displayed on the bank Doovie. Added it all together went to my you-beaut % calculator and simply found the % difference from first to last, simple!

I am hoping my new end of week table is laid out sufficiently clearly to demonstrate what I have just said in words. I tried to keep it as clear and simple as possible.

The essence of what I am trying to achieve with this thread can be condensed into a single word improvement.

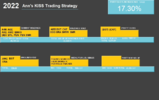
OK, so seeing I already had this prepared let's just put up another let's get simplified pic.

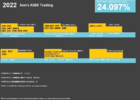
Single word.jpg
 
@Ann, without looking/ reading fully ur above post (family day here) many apologies for detracting from your intention of simplicity, certainly wasn't what I intended. Will read fully when time allows.
 
@Ann, without looking/ reading fully ur above post (family day here) many apologies for detracting from your intention of simplicity, certainly wasn't what I intended. Will read fully when time allows.
Absolutely no apologies required Craton, I am always very grateful for any interest taken in anything I have to say and it gave me an opportunity to explain to any readers exactly what I am trying to do, so your input is really valued, thank you!
 
Thanks for fixing the heading @Sean K. I think adding the word 'Trading' makes it clearer about the thread and its contents. Oversimplification can also be misleading!
 
Crikey it looks like I am going to cop a loss with another stock, it has been below my stop loss trigger for three days, my gut is saying hold, my brain is saying nuts to my guts! Still, the portfolio is doing OK so far thanks to the U stocks mostly.

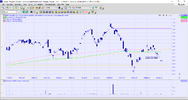
BNKS stoploss area.png

PORTFOLIO TRACKER 8.4.22.png

doovie 8.4.22.png
 
CRIKEY! 1st officer ANN
This is not SIMPLE
It Is " VERY COMPLICATED" IMHO
Crikey!
If you think you are a Nut shell
You are probably a" NUT"
IMHO

Best of luck Sailing with nuts
 

Attachments

  • Untitled.jpg
    Untitled.jpg
    53.7 KB · Views: 4
Ahoy Brave and Loyal !st Officer Ann
I'll try to post you all TEN ( 10) charts before Monday's open

I am only here to help my most Brave and Loyal

XXXOOO
 

Attachments

  • HMAS  Ship of Fools.gif
    HMAS Ship of Fools.gif
    28.3 KB · Views: 2
Ahoy Brave and Loyal !st Officer Ann
I'll try to post you all TEN ( 10) charts before Monday's open

I am only here to help my most Brave and Loyal

XXXOOO
I shall look forward to them, good Captain, I appreciate your loyalty. I love a good IC chart!

d16c4jl-49244b61-5907-4be5-990c-6c58de88a232.gifavat.gif
 
Let's Start at the Beginning

Most people ask me if I am a Short Term, Medium Term or Long Term trader
I always say NONE of the above

I am merely a Man of the Sea ( as in Mankind )

I go as the Seas and Weather Conditions Prevail

In the eyes of the" Technical"
You must ALWAYS trust the readings you get from your instruments

I like to go to Sea on the ASX as the Seas and Weather conditions dictate

I use the Weekly charts and the Daily charts to determine
"HOW MUCH SAIL " I have presented to the Wind
IE; One sail based on the weekly and One based on the daily readings

EG : Invest say ~$5000 on your daily chart readings and ~ $5000 on your Weekly

It is amazing how you sometimes have TWO ( 2) sails presented to the wind
and other times NONE (0) sails presented to the Wind

Some become Short Term
Some become Medium Term
and
Some even become Long Term Bonanzas

ONLY the Seas and the Weather conditions dictate whether you are a Short term, Medium term, or Long term Man or Woman of the SEA

PS; Charts to follow
 

Attachments

  • HMAS  Ship of Fools.gif
    HMAS Ship of Fools.gif
    28.3 KB · Views: 1
Top