Australian (ASX) Stock Market Forum

KISS Trading with Ann

Hi Ann, my suggestion would be to study candlestick analysis rather than volume. If you decide to do this and want any recommendations of where to find free info then let me know.
Thanks, for the suggestion Dave, suggestions are always greatly appreciated and welcomed. Candlesticks was one of my earliest studies back around 2004-2006, I bought books and studied charts. It took me nowhere. It was as good as a coin toss for me. There was one fellow on IC charts forum who swore by them and I suggested we would be very interested if he could give us a running commentary of a trade or two using candlesticks. He declined the offer. However, I would never dispute the benefits of candlesticks as long as you can see them in your mind. I just use them for good levels of gaps and identifying island tops and bottoms patterns. Although now they will be an integral part of VSA.

It is only early days with my volume study which kicked off here... https://www.aussiestockforums.com/t...xt-catalysts-an-application-to-trading-stocks.

Already I am seeing risk-reward potential. It is going to take me ages to do forensics on my current trades and where I could have improved on an entry or exit I have 24 holdings and about 10 recent exits so it won't be a five-minute job! I have been looking at videos on VSA (Volume Spread Analysis). So far they are not telling me anything I haven't already observed in the short time I have been looking into this, other than the size or spread of the candlesticks. That was useful and interesting information.

Thanks again Dave, I appreciate your input. :xyxthumbs
 
What most don5 understand is that price action and it’s indicated meaning in a price move record3d in a candle or a bar, is nothing more than an indication of what may happen.

THEY ARENT BUY OR SELL SIGNALS

Until confirming price and volume action is evident

THEN a low risk ( up to you to determine )
can be considered.
 
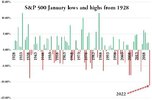
I will often top up my portfolio in January as it tends to be a pretty good month generally. Well, this month is the exception and I really mean EXCEPTION! I found an interesting graph someone created using the lows and highs of January for the S&P 500 going back to 1928.

However, it did give me the opportunity to show how I handle a fall in the markets. This is the first time I haven't been in the money and the first time I have been faced with capital loss, but I have no intention of cutting and running just because I am in the red. I will keep my tolerance parameters at the same position as if I was well up. I may or may not lose capital, time will tell.

Historic January lows.S&P 500jpg.jpg
 
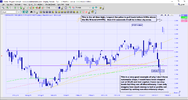
I am going to talk about two of my holdings today, the first one is ORA. It illustrates quite clearly how having an automatic stop loss can lose you capital and potentially cost you some returns. ORA speared down below my stop loss level and just as quickly speared up and some. This was something I rejected when I read Weinstein's book Trading in Bull and Bear Markets. He worked with automatic stop loss and even worse, automatic buys. I thought both of those were somewhat dangerous and I still feel that same way. To date, I have never regretted having a discretionary stop loss.

ORA blue sky 18.2.22.png


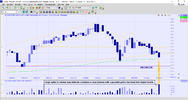
The next is poor little BST, it looks like it fell back again to retest the 200dema. That puts the stock 23.86% down in my portfolio. I discovered the 200d exponential ma works with new stocks whereas the 200d simple ma does not, obviously all in the calculations! So this shines a whole new light on new stocks for me.

I have been doing a lot of work with volume spikes recently and as I watched the reaction of stocks to the V spikes, I noticed that if a volume spike occurs at either the top or the bottom of a price rise or fall, the price will reverse its direction. Wow, I think only a picture would make that comment clear! The next trade or two will confirm this but hopefully, there will be a good rise in BST as there was a decent volume spike going with the price plunge back to the 200dema.

BST vspike 18.2.22.png
 
@Ann when you speak of the "200dema" are you referring to the "200-day (EMA) or 200-day (DEMA)?

As @rnr remarked they are different as a "Double Exponential Moving Average" (DEMA) is a technical indicator similar to a traditional moving average (MA) & (EMA), except the lag is greatly reduced.

I discovered the 200d exponential ma works with new stocks whereas the 200d simple ma does not, obviously all in the calculations! So this shines a whole new light on new stocks for me.

I've deleted my previous post as my question has already been answered.

Skate.
 
having an automatic stop loss can lose you capital and potentially cost you some returns
Ann this is a case of 'one size fits all' does not apply the the stock market. Penny stocks can be much more volatile because institutions don't trade stocks under $10. I haven't read Weinstein's book but he may have been working with a different type of stock. So as you are doing now we must adjust the way we trade depending on the type of stock being traded and the market environment we are trading at that time. Hope this helps.
 
Hi Ann
with your portfolio, is it a virtual one or you actually have put money into it ?
Some of the technically good stocks though I have not followed closely, gone down. I suspect it is only temporary .
All the best,
Hi Miner, yes they are all part of my larger portfolio, with the $value as quoted. I was going to buy more shares for my portfolio and decided to share with everyone why I chose them, where I found them and how I am trading them.
 
Hi Miner, yes they are all part of my larger portfolio, with the $value as quoted. I was going to buy more shares for my portfolio and decided to share with everyone why I chose them, where I found them and how I am trading them.

@Miner, Ann has answered you but to be perfectly clear those positions are positioned placed in a CommSec watchlist, that's all. Also for further clarification, those positions can also be in a trading portfolio & separated for this example.

Skate.
 
Ann this is a case of 'one size fits all' does not apply the the stock market. Penny stocks can be much more volatile because institutions don't trade stocks under $10. I haven't read Weinstein's book but he may have been working with a different type of stock. So as you are doing now we must adjust the way we trade depending on the type of stock being traded and the market environment we are trading at that time. Hope this helps.

I just checked Weinstein's book and all the charts he was quoting were high price stocks, no penny stocks I could see. Shortly I am planning to have a fiddle with some penny dreadfuls, these have historically not been my area but I think I will continue to ride bareback, so to speak! Time will tell if I lose some money or not without auto stops with penny stocks. However it will only be a couple of grand a stock, so nothing that does me any real damage if I lose an odd one here or there.
 
@Miner, Ann has answered you but to be perfectly clear those positions are positioned placed in a CommSec watchlist, that's all. Also for further clarification, those positions can also be in a trading portfolio & separated for this example.

Skate.

Not Commsec Skate, it is Westpac and they don't offer a trading portfolio that is separate from my main portfolio. A watchlist is the only way I can do it with Westpac.
 
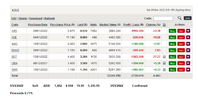
Rightio, how did we do this week? Not so well, I decided to jettison CKF. I had lifted its stop loss from $11 to $11.41 as a prudent move the way the markets were behaving. The price remained under that level into the fourth day. Sadly it attracted a $ loss. I didn't think it could withstand further market falls and took the opportunity to sell into a rising day for the shares on Friday after it became clear it was not going to lift above stop loss. None of my other stocks fell below stop loss.

When I sell at a loss I always do a 'forensic analysis' of the trade to work out where I made a mistake. It is something I have always done in a constant effort at self-improvement, not to be confused with self-criticism, I never do that it damages the psyche.

Under the prevailing and uncertain conditions of the week with the Ukraine invasion, I feel the move up of the stop loss was prudent and subsequent sale was correct. However, there was a major mistake I made that would have delayed or stopped the sale. Every morning I check Stockcharts for the outcome of the markets for the last US close, I totally missed the volume spike under the low on the S&P500 for the Thursday close. It was there but hidden under a price level, no excuse, I should have set the volume for below price and not the auto setting of behind price, I am well aware of the vital importance of volume spikes as I have been working on them for a couple of weeks now. I believe based on the volume spike, we will be seeing a rise in the stock markets over the next period of time, I have no idea if it will be a dead cat bounce or a resumption of higher prices.
This is a lesson now learned and in future, all volumes will be viewed in a separate window and assessed before decisions are made.

Just for interest I will look back at CKF next week and see what the outcome would have been had I not sold.

CKF byebye 25.2.22.png
 
I believe anyone who had skin in the markets over the last month or so would have similar if not larger drawdowns.

I'm enjoying your thinkin' and charts @Ann.

gg

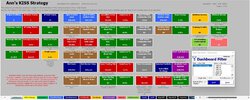
@Garpal Gumnut I'm sure those trading systematically would have larger drawdowns. My "Flying Bat Strategy" is down (-11.3%) & my "Platinum Strategy" is down (-5.6%) for the same period whereas Ann's "KISS Strategy" is only down (-4.1%).

Not too shabby
After looking at @Ann KISS Portfolio results the "KISS strategy" is traveling along nicely under very trying trading conditions, well done.

Portfolio Results are more accurate
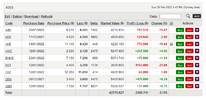
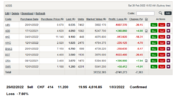
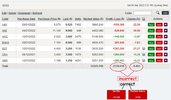
Using a Portfolio rather than a "Watchlist" the results become clearer. The "Watchlist" reports a loss of -$2,741.273 (-7.363%) which doesn't do the "KISS Strategy" justice. The "Watchlist" reports the value of open position value & doesn't take into consideration the positions sold from the portfolio.

Watchlists
I should also say a watchlist is a snapshot in time of open positions "only" that can be misleading to the true value of the portfolio.

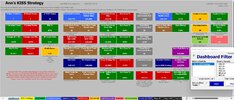
Ann's KISS Strategy DASHBOARD.jpg

Skate.
 
Thank you for taking the trouble to do this table @Skate, most appreciated. :xyxthumbs When I have time I will work out what it says, too complex for me with only a quick glance. :happy:
Another sale this week, ABB. Will put up a chart another time, too busy atm. The sale was to do with a volume spike. I am practising trading with V spikes, skin in the game is the only way I can learn, backtesting can only take me so far then I need to put cash on the table or in this case, take cash off the table.
doovie 4.3.22.png

blue and yellow eyes.jpg
 
Thank you for taking the trouble to do this table @Skate, most appreciated. :xyxthumbs

@Ann as this is an interesting project displaying "accurate results" will give others a true indication of how this portfolio is progressing. The "KISS strategy" is still traveling nicely under trying trading conditions.

Watchlists
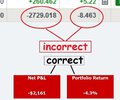
The watchlist capture below is a snapshot of the results of "open positions" that can be misleading. Using the "KISS Portfolio" rather than a "Watchlist" the results become clearer. The "Watchlist" reports a loss of -$2,729.018 (-8.463%) which is inaccurate & doesn't do the "KISS Strategy" justice. The true results are much better.

Ann's KISS Strategy.jpg


Ann's KISS Strategy DASHBOARD.jpg

Summary
If you don't mind, I'll update your KISS Portfolio after your report your weekly "buy & sells". Even though the portfolio is in the red at the moment the results at this stage are "insignificant". The portfolio return of (-4.3%) is a good result at the moment considering the current trading conditions.

Skate.
 
Summary
If you don't mind, I'll update your KISS Portfolio after your report your weekly "buy & sells". Even though the portfolio is in the red at the moment the results at this stage are "insignificant". The portfolio return of (-4.3%) is a good result at the moment considering the current trading conditions.
That would be great Skate! Thank you for your chart clarification, there were a few too many squares for me to ferret out the simple bit at a quick glance.

This was much easier to understand.

Ann's KISS Strategy.jpg
 
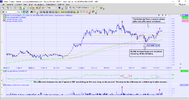
OK, let's look at ABB. I sold this last Tuesday (March 1st) as it had a reasonable volume spike on the day before (Monday). I want to work on volume spikes but I can't do it academically with backtesting. I need to do it and succeed or stuff up. Stuff up is always preferable. On this occasion, I think I stuffed up and will miss some more highs coming from ABB. I was wondering if a volume spike would trump a bullish inverted Head & Shoulders which had just bounced off the 200dsma. In normal circumstances, I would never have sold, having seen this excellent chart set-up. What I missed was Twiggs money flow. On the first volume spike reversal, the money flow was falling, on this volume spike, the TMF was lifting. This is a lesson learned. I am not used to trading with indicators strapped to the bottom of my charts. I usually only look at the chart itself. If I had only looked at the chart I would certainly not have sold ABB. Let's see how it pans out, whatever, I am going to learn stuff, always a good thing! ?

ABB sold 4.3.22.png
 
Top