Australian (ASX) Stock Market Forum

KISS Trading with Ann

Welcome back.

thanks I didn’t know iId been anywhere
tech it's more than that to institutional traders.
Oh
I’m afraid support from institutional investors isn’t a buy signal for me. About as profitable as buying a 200 M/A

just take a look at the last 12 mths it’s only traded over $12 for half of that time
With a max price about 25% higher with no indication (yet) that it’s going to test the latest high
To me pretty Ho hum and right now why would you buy it—- technically
but let’s watch it

FMG became a great buy from a bad prospect ( technically ) Take a look at the thread if interested.
 
thanks I didn’t know iId been anywhere

Oh
I’m afraid support from institutional investors isn’t a buy signal for me. About as profitable as buying a 200 M/A

just take a look at the last 12 mths it’s only traded over $12 for half of that time
With a max price about 25% higher with no indication (yet) that it’s going to test the latest high
To me pretty Ho hum and right now why would you buy it—- technically
but let’s watch it

FMG became a great buy from a bad prospect ( technically ) Take a look at the thread if interested.
Tech my comment was not about the stock, I don't trade Australian markets.
 
for what it’s worth I think this is a terrible trade on many levels
Just not a trade I’d be interested in
many many more high potential trades
BRN CXO to name a couple.
a 200 M/A is just an average of numbers means bugger all.
You may very well be right about CKF John, time will tell.
I really doubt CKF will ever achieve a viagrafic erection anywhere like either BRN or CXO! :D

I like the look of CXO, I will mark the chart with a Tech/a recommendation, thanks! I will keep an eye open for a retrace entrance, I need another lit stock.
The 200ma is just a line in the sand. It is up to each of us to create a framework of limitations both in life and on the charts. As I keep saying to folks, if it works for you, good....if not then don't! :)

Thanks for your comments and contribution, most appreciated!
 
Many Newbies are drawn to threads like these
Particularly when implying a KISS type methodology

I guess an explanation that stock trading over a 200 M/A is generally moving up
Which in keeping with KISS you want to buy stock moving up
The M/A alone is nothing reactive
 
I guess an explanation that stock trading over a 200 M/A is generally moving up
Which in keeping with KISS you want to buy stock moving up
The M/A alone is nothing reactive
If your stock falls below the 200ma then it may cause a trader/investor to react. Over the last 20 years, I have managed to keep clear of any major market falls by simply exiting a stock if it maintains a price below 200dma. If it lifts back up over at a given point be it the 200ma or a support/resistance line then nothing to stop you from moving back in after it shows a rising curve. Not to be confused with a sideways consolidation period which would cause the price to oscillate around the MA and go nowhere for a period.

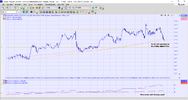
My KISS philosophy should not be confused with an 'easy way' to trade. It is me demonstrating how I buy in or sell a stock using the most basic and simple chart indicators of two MAs and three trendlines moving up, down or across and the price level. I have practised this for 20 years on almost a daily basis, it is not easy! The 200dsma is also not a strict rule. If CKF falls below the 200dsma I have drawn a support line of $11 which is a point where the price has been used as a pivot point of support and resistance over a reasonable while, which suggests a level of strength. If CKF fails this $11 support line that will be my signal to exit. I would be in serious minus at the $11 mark but this stock will pay me 'rent' (dividend) for my money while I wait for it to rise again, better interest than any term deposit.

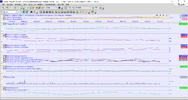
Having said that, I do have a set of indicators strapped to the bottom of my chart I glance at occasionally. They can be a handy reference but it is the chart and its few contents on which I focus.

Here is my current list of indicators, some I keep always like the PVI, MACD and Twiggs Money Flow. The rest come and go as I please.


Indicators 15.2.22.png
 
just take a look at the last 12 mths it’s only traded over $12 for half of that time
With a max price about 25% higher with no indication (yet) that it’s going to test the latest high
To me pretty Ho hum and right now why would you buy it—- technically
but let’s watch it
Yes, it has certainly been travelling in a sideways consolidation showing a gradual rise as evident by the 200dsma since about March '21. I find the longer the consolidation period, the better the breakout generally. Once this bounces off the 200dsma (if it does) then I always feel this gives a stock a bit of energy for a reasonable rise.

Once CKF can rise above its $14 level it is all blue skies, this stock does not have a long term falling trendline or other highs to smash down on top of the price at some future date. So one could say, the sky is the limit!

One indicator I really like and have used forever is the PVI or as I call it, the 'prat meter'. It is supposed to be what the dumb money is doing. I have found over the years the dumb money is a pretty good indicator of general market sentiment.

I can see on the PVI overall CKF has pretty good market sentiment, so far.

CKF prat meter 15.1.22.png

(damn, I wish I hadn't already prepared dinner, I want KFC!)
 
I concur with the 200 M/A I used it on techtrader and kept the system out of the 2007/8 crash

I be still use a modified for of T/T today for longer term trading

for Short term I don’t use any indicators
Only Volume, Gaps. Support and resistance, Price, Control zones in price and Volume

pretty simplistic
 
Once CKF can rise above its $14 level it is all blue skies, this stock does not have a long term falling trendline or other highs to smash down on top of the price at some future date. So one could say, the sky is the limit!
I'm not real sure about what's going on. But Ann, how could you trade a stock at such a loss. Sure its activity has hit your support of 50ma, but who's to say it will bounce back to $14. I'm shocked at your impression. A fun trade indeed. i see you take the gamble that its exhausted at $12. I still say a 30wk m/a should be on order. i'm sorry to see your trade, what are the fundamentals...Don't you get frustrated...Interesting to see your philosophy go to work? You will be lucky to get 10%?
 
Last edited:
The moving average concept is important. I generally use either 20 or 50, because I'm a shorter term trader/investor. But even so, after some time watching charts, I know where those levels are generally going to be, but I still use it as a reference of course. Most of the charts I past up have 50 and maybe 200d ma for mums and dad stocks or indexes. I now just trade support and resistance lines in stocks that have my own perceived value, until they're fully valued, or have overshot. Unfortunately, I've been on the sidelines of the tulip-lithium bubble going on at the moment because I look at fundamentals first and then trade the chart. Most of the lithium things pinging have zero intrinsic value and it's 100% speculation.
 
The moving average concept is important. I generally use either 20 or 50, because I'm a shorter term trader/investor. But even so, after some time watching charts, I know where those levels are generally going to be, but I still use it as a reference of course. Most of the charts I past up have 50 and maybe 200d ma for mums and dad stocks or indexes. I now just trade support and resistance lines in stocks that have my own perceived value, until they're fully valued, or have overshot. Unfortunately, I've been on the sidelines of the tulip-lithium bubble going on at the moment because I look at fundamentals first and then trade the chart. Most of the lithium things pinging have zero intrinsic value and it's 100% speculation.
That is the interesting thing with investing, there is no one size fits all, everyone is at different stages in life, has a different risk tolerance, has a different amount of money they are prepared to risk, may be investing as their only income rather than as a hobby, may be living off the dividends, so many variables.
When I was working losing $20k meant very little, now that my only income is from my investments and I have zero chance of gaining employment, $20k takes on a whole new meaning. :eek:
 
The moving average concept is important. I generally use either 20 or 50, because I'm a shorter term trader/investor. But even so, after some time watching charts, I know where those levels are generally going to be, but I still use it as a reference of course. Most of the charts I past up have 50 and maybe 200d ma for mums and dad stocks or indexes. I now just trade support and resistance lines in stocks that have my own perceived value, until they're fully valued, or have overshot. Unfortunately, I've been on the sidelines of the tulip-lithium bubble going on at the moment because I look at fundamentals first and then trade the chart. Most of the lithium things pinging have zero intrinsic value and it's 100% speculat

Another reason why I just trade the chart.
Opportunities don’t give you a week analyse
Often the best defy All logic.
price will tell you and you only need 1:10 with sound Risk management
 
Another reason why I just trade the chart.
Opportunities don’t give you a week analyse
Often the best defy All logic.
price will tell you and you only need 1:10 with sound Risk management

Yeah, I used to do both, but found my niche. I could go back to intra-day trading charts now I'm retired and sitting in front of the screen all day, but it doesn't suit my psychology. So, each to their own with how you invest and trade. There are many ways to skin a cat.
 
It can be this simple.

POP

There's your sign!!!

Even grabbed a few myself

 
Once CKF can rise above its $14 level it is all blue skies, this stock does not have a long term falling trendline or other highs to smash down on top of the price at some future date. So one could say, the sky is the limit!
I stand mistakin. Took the liberty of looking at a summery of Collins Foods Limited (CKF) is a KFC and Taco Bell franchisee in Australia and KFC franchisee in the Netherlands and Germany, the owner of Sizzler restaurants in Australia. CKF operated 240 franchised KFC restaurants in Australia, 17 franchised KFC restaurants in Germany, 23 franchised KFC restaurants in the Netherlands and 12 franchised Taco Bell restaurant in Australia, which all compete in the quick service restaurant market. The Group owns and operates nine Sizzler restaurants in Australia, which compete in the casual dining restaurant market. It is also a franchisor of the Sizzler brand in South East Asia, with 75 franchised stores predominantly in Thailand, but also in China and Japan.

I don't see any reason why it wouldn't bounce back to $14. Unless they are having certain complications, and a continued falling momentum defaults current trend. But as you say Ann its at 50m/a considered a breaking point of support and 200m/a as consolidation it appears in good stead to advance.

I couple of things to consider are what is the impact that the covid 19 is having and I understand that sizzler restaurants in Australia are closing down, I don't know about the rest of its constituency. But all the best...
 
It can be this simple.


Ok I get the right cross.
Ill foook off
 
Top