Australian (ASX) Stock Market Forum

KISS Trading with Ann

i agree in general , and have learned to be suspicious when a small under-performer hires a 'high-profile ' exec. , but investing is also about spotting the actual opportunity as well .

One always needs to assess if a company is 'investment grade'. When I was a young and beeuutiful lass, I would assess a bloke as in is he a long-termer, a mid-range squeeze or just good for a quick slap and tickle? This is what I do with stocks as well.

As far as TLS is concerned, I hold but I can see TLS is more your mid-range squeeze. I did a swing trade calc on it and have assessed a price and put a for-sale-sign out on it. There is a very long term falling overhead-trendline coming up shortly and it pretty much matched the swing trade calc. I think that is as far as it will go and have priced it for sale just under that line. If I am wrong, then nothing lost, I can go back in if it succeeds to maintain a level above the falling trendline. I doubt it though, I reckon it is headed in the same direction as AGL and all the other shorted-to-death stocks.
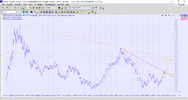
TLS 27.12.21 swing trade exit.png
 
@divs4ever I personally think the telco sector is one of the hardest sectors to do business in, a bit like the electrical power sector, a semi public service so highly regulated.
Telstra has shown how difficult it is , they still are no where near their final tranche float price and that is with a huge taxpayer injection through the NBN.
As I said only my personal opinion, but when all the competitors are selling the same product, it makes it hard for them to sell themselves other than on price, which ends up eating into their profits. Its just not a sector I can get excited about.
Just my opinion.
one factor that makes the Australian sector hard is the Australian Government keeps taking a slab of the steak ( from the cash-cow ) via selling wireless broadband spectrum , whilst dirtying the pool with the NBN

' excited in ' , no i am not ' excited' in it currently i did well overall in REF , struggled to crystallize a profit in TLS , did nicely in TPM when David Teoh was running it ( seems to be losing momentum now .. i bought TPM @ $1.40 ) , HOWEVER i do see gaps that a clever , well-run player could expand into ( but does Australia have a management them left that will want to negotiate the regulatory landscape as it currently exists . )

but i should be parking more cash WISELY so am looking , looking and thinking , ( in sectors and niches both big and small ) and this has previously been a great period to pick up a handful of small caps and micro-caps ( small investments in a thinly traded market )
 
HOWEVER i do see gaps that a clever , well-run player could expand into ( but does Australia have a management them left that will want to negotiate the regulatory landscape as it currently exists . )

Well, for what this is worth, when I was assessing the chart for ABB in preparation for buying it, my son who is an IT programmer/coder of clever stuff I can't understand, like doing stuff for the defence department, wandered in to home, saw what I was looking at and said it was a really excellent company but with limitations. I looked at him like WTF would you know about it....he said, "that is all part of what I do". OK, I said tell me about it. He said he felt its customer service was going to fall over as they were getting so big. Right I said, they just took over OTW would that make a difference...? Certainly looks like that may be the answer, he said.

That was not a deciding factor as I only buy from what I see on the chart but it made me feel quite comfy about it.
 
One always needs to assess if a company is 'investment grade'. When I was a young and beeuutiful lass, I would assess a bloke as in is he a long-termer, a mid-range squeeze or just good for a quick slap and tickle? This is what I do with stocks as well.

As far as TLS is concerned, I hold but I can see TLS is more your mid-range squeeze. I did a swing trade calc on it and have assessed a price and put a for-sale-sign out on it. There is a very long term falling overhead-trendline coming up shortly and it pretty much matched the swing trade calc. I think that is as far as it will go and have priced it for sale just under that line. If I am wrong, then nothing lost, I can go back in if it succeeds to maintain a level above the falling trendline. I doubt it though, I reckon it is headed in the same direction as AGL and all the other shorted-to-death stocks.
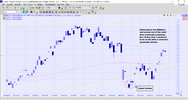
View attachment 134807
LOL

not me , i noticed the females were choosing elsewhere , and discovered hobbies and sports , and nicely side-stepped many complications ( i can revisit old hobbies , and stuff without any big jealousy flare-up , for instance my guitars never seem to complain if i pick up a bass , or keyboard , although some of the computer servers might whine a bit when started up )

TLS promised too much , and delivered too little for me , maybe i will revisit in the future but i suspect the corporate culture there won't change enough to lure me back ( had uncles and aunts that worked there when it was PMG and Telecom .. the name has changed but not the bureaucratic heart )

but several large cap ASX listed companies look like going into a long dark lane-way ( ORG does not seem to be shining brightly either )

with the take-overs of SKI and AST the sector might be worth watching though , but after the AST take-over completes , the NZ companies ( CEN , GNE , MCY and MEZ ) are my major utility plays , i doubt CCE will ever rise above being a R&D money-pit ( in my lifetime )
 
Well, for what this is worth, when I was assessing the chart for ABB in preparation for buying it, my son who is an IT programmer/coder of clever stuff I can't understand, like doing stuff for the defence department, wandered in to home, saw what I was looking at and said it was a really excellent company but with limitations. I looked at him like WTF would you know about it....he said, "that is all part of what I do". OK, I said tell me about it. He said he felt its customer service was going to fall over as they were getting so big. Right I said, they just took over OTW would that make a difference...? Certainly looks like that may be the answer, he said.

That was not a deciding factor as I only buy from what I see on the chart but it made me feel quite comfy about it.


i might just be me , but customer service seems to be a fairly low hurdle in telcos ( and bigger utility companies )

but i rarely buy a stock with the INTENTION of a short hold time ( although some like ART , for example , make a choice i would rather not be a partner in , so jump , quickly , especially if in profit )

will be glancing at ABB from time-to-time but not so certain i will be parking cash there
 
I was not around this week so nothing new, plenty tempting me so perhaps next week will see some more additions.

Currently, Westpac trading is down, guess they are taking the opportunity to blow some dust out of the servers. Hopefully later today or perhaps tomorrow I will put up the little window doovie. However, all are doing OK, so far.

In the meantime let's look at how OOO is going following its 'island bottom' pattern. This is such a favourite pattern of mine, my greedy juices start to flow when I see one. As with all chart patterns it can fail to deliver, I am yet to have a failure with this pattern.

OOO 2.1.22.png

Let's talk a bit more about this shape. If you use EOD charts you just won't see an island bottom/top pattern of course and if you use OHLC you are highly unlikely to see it as the gap appears closed. Using candlesticks makes ignoring the 'noise shadows' a lot easier and an island bottom is much easier to spot. It is so worth finding this chart shape!

This is the same chart just with using OHLC, I would be challenged to find this shape using OHLC kindling! :)

OOO OHLC 2.1.22.png
 
Currently, Westpac trading is down, guess they are taking the opportunity to blow some dust out of the servers.
I have been with Westpac for some time but enough is enough. I have switched to Nabtrade for a few reasons:
  1. WP Trader Pro has too much downtime due to Java problems;
  2. I have felt guilty using the complimentary Viewpoint from my full time broker while trading mainly on WP online;
  3. the NAB resources are far better than those on WP;
  4. NAB has Viewpoint which does not rely on Java and I can use on other platforms
so now I can have a good look at your OOO.
 
Currently, Westpac trading is down, guess they are taking the opportunity to blow some dust out of the servers. Hopefully later today or perhaps tomorrow I will put up the little window doovie. However, all are doing OK, so far.
sorry but i don't do that anymore , they went with different sub-contractors , and i am retired ( so i can't tell you if your theory is correct )

pay peanuts and they get monkeys

but good luck with your trading/investing

PS for Country Lad , i never sub-contracted for NAB , but a different rival had ideas that raised an eyebrow ( and that wasn't MQG , i subbed there as well )
 
I have been with Westpac for some time but enough is enough. I have switched to Nabtrade for a few reasons:
  1. WP Trader Pro has too much downtime due to Java problems;
  2. I have felt guilty using the complimentary Viewpoint from my full time broker while trading mainly on WP online;
  3. the NAB resources are far better than those on WP;
  4. NAB has Viewpoint which does not rely on Java and I can use on other platforms
so now I can have a good look at your OOO.

Thanks for the advice Country Lad, however it is a Superannuation Account and all the messing around to change to another banking system is simply a nightmare, with all the form filling and paperwork associated with it. I will just suck it up. It has never caused any problems when I have been trading. It only very occasionally impacts when I am doing a bit of research or wanting to download my window doovie thingo.

I only need the basics and that is what you get from Wespac but then I prefer to keep all things in my life as simple and minimal as possible, so it works for me. Plus I had the feeling on Friday afternoon I should screen print the window, so it is my fault for not doing so.
 
Let's talk a bit more about the Island Bottom pattern. This is not a rare or unheard of pattern, no doubt many chartists have made money from this. I have been fortunate that it has always done what I hoped it would. Now today as I was browsing through the charts, as I do, just for fun, I was shocked when I looked at the APT chart. I counted no less than five Island Bottom patterns over a six month period. All but the first two failed to give a return and those first two were only fairly minimal successes. So here is a very good example of Island Bottom patterns failing. The IB pattern was quite clear regardless of whether you used candlesticks or OHLC.

EDIT: Don't hold.
APT 31.1.21 Island bottoms.png

APT 31.1.21 Island bottoms.OHLC.png
 
Added a new one this week AKE. Disappointing trade on a couple of levels, first I arrived home on Friday 31 Dec and put a bid against AKE at 3.50pm for $10.40 which was quoted as the current trading price. Nothing happened! Bloody market closed early, didn't it? I like a dumfk didn't give an early close a thought prior to placing my bid. I had been home for about an hour before I went to the market, which compounded the irritation.

I thought stuff it, I will pull the bid down over the weekend, no, Westpac Trading was down, so I couldn't lift it. Monday came and I still couldn't access the site until after the market opened. Did I pull the trade out then? No! I bloody traded on a Monday, I hate trading on a Monday, it is when all the weekend warriors have got themselves all excited and pushed up prices. I know better, so smacked myself for the rest of the week.

Anyway, why did I want to buy it? It appears that Lithium may have a bit more upside. It is a stock held by the US ETF LIT, so there is international attention. Then there is the chart itself, when I got home I noticed while I was away it had broken out of its sideways consolidation with a degree of energy and had maintained its position. It may fall back a bit to test the $10 or $10.50 level. Not something I would mind particularly. There are a few support lines both trending and horizontal. Let's see how it goes.

I see ABB made an effort at the $4 level during the week as we suspected it might, there still may be a chance it will try again. Let's see.

AKE BUY 7.1.22.png

I am still working to get the pretty graph up, perhaps next week? In the meantime, I took a screenshot of the Westpac Doovie window.

Doovie 7.1.22.png
 
No! I bloody traded on a Monday, I hate trading on a Monday, it is when all the weekend warriors have got themselves all excited and pushed up prices. I know better, so smacked myself for the rest of the week.
I long held the same view, that the Weekend Warriors as you call them would work out orders over the weekend, then place their bids at 2-3 percent above last close (for buy orders) just to make sure they were filled. My view extended to the rest of the week, where I thought end of day traders would get home from work, and place their orders so that they would be filled at the next open, again at 2-3 percent above last close.

My view was reinforced by all the terrible fills I would get if I traded at the open. Too many to talk about. Only to see the price return to normality after about 30 or 60 minutes or so.

However, I was sadly mistaken. I tried to model this phenomenon and the obvious alternative, which is placing the same order at the day's close instead of the open. Each time I did so, placing an order at the open came out on top.

Another theory bit the dust.

You're right, it may be just a Monday thing, and next time I have a clear head I'll restrict the test to the Monday open, and see how that goes.

Maybe I think too short term. Yes, they are bad fills at the open, but after a few days or weeks the stock is either sold or the fill is forgotten.

KH
 
Maybe I think too short term. Yes, they are bad fills at the open, but after a few days or weeks the stock is either sold or the fill is forgotten.
A long time ago, I gave up trying to either buy at the bottom or the top. If I am in the mood to buy and the price looks OK on the chart, I poke go. More often than not a day or two after, the price goes lower. I really couldn't give a toss as I have bought on a chart shape where I felt there was a potential upside, so if I have to suck up a bit of pain, so be it. I just can't be bothered obsessing.

As far as the best day or time to buy, I doubt there is one but on Mondays and lunchtimes, I can feel the irrationality of the crowd and I don't like the feeling. I like to trade either mid morning or mid afternoon. I like the feel of Friday afternoon as well.
 
I bought a lot of stocks this week, so trying to put them all up on Sunday would do my head in so I will post up a couple each day.
This first stock AWC is a re-entry. I am happy with this trade on a couple of levels in that I sold when I decided to sell at a stop loss level. All my trades are manual, I never use an auto stop. Then I have been waiting for a re-entry at a given point, which I did, as illustrated on the chart. This is one of the stocks that has made me decide I need to improve my trading. I gave good money back to the market by holding onto this stock much longer than I should. I feel if I had been riding this with a faster/higher rising support and once broken down after consolidation level, exit the thing. This is what I will be trying to do going forward. I won't put up a chart of how I thought I should trade the stock because I always think backtesting is sheer bullsht. This is why I am attempting to chart forward on this thread.

Talking about charting forward, I am thinking anyone who wanted to hop into ABB cheaper may have missed their chance. I think it made a valiant attempt at touching the 200dsma but didn't quite make it. I am happy enough that was a good enough 200dsma bounce for that extra vim and vigour for a rise.

AWC re-buy 12.1.22.png
 
The next one is CKF. I found this on a list of holdings of VHY back in 2020. The chart didn't inspire me, it looked like it was in a consolidation phase, I was after a bit of growth along with some divies back then. The next time I looked back in June '21 it looked like a bit of a bubble too far from the 200dsma. Recently I looked at it again and I see it plummeting back toward the 200dsma and the rising support line from mid March '21. So far it has displayed higher lows and higher highs, works for me I thought, so worked out a price I wanted to bid $12.05 just above the rising support and 200dsma. Later in the afternoon, it filled. Good, I thought, then I saw the news reports about KFC having supply chain problems and not having a full menu. Awesome I thought, here comes d'pain. It may well fall to the pivot level of $11.00. Tuff, I will just suck it up, it will pay me some rent with its divie while I wait for a recovery.

Although perhaps it will hold the 200dsma, let's see.

I should add this is one of your Warren Buffet sort of stocks for me, in as much as I like the product very much as it is the most protein intensive T/A food, too much starch makes me really crook, so having KFC is a really tasty treat which does no harm.

CKF 12.1.22.png
 
Hi Ann, appreciate what your doing, and good to see that your stocks are improving, but can I please suggest a 30 weekly ema moving average. i find that stock moving above this line should be considered Bullish. Stocks below at a loss. This is probable as a long term position and i thought it may be something you would like to try as a support base line.
Anyway keep up the good work, I wish you all the best.
 
Last edited:
Hi Ann, appreciate what your doing, and good to see that your stocks are improving, but can I please suggest a 30 weekly ema moving average. i find that stock moving above this line should be considered Bullish. Stocks below at a loss. This is probable as a long term position and i thought it may be something you would like to try as a support base line.
Anyway keep up the good work, I wish you all the best.
Stockybailz, thank you very much for offering a suggestion, I love looking at new things and it may well have been something I had not considered, so I really appreciate your comment. :xyxthumbs

Way back in about 2003 I found a book that made all the difference to my understanding of charts and charting. It was one of those 'AHA' moments as I read the book. It was of course Stan Weinstein's 'Secrets for Profiting in Bull and Bear Markets'.
He used to look at weekly charts using 10 and 30 wk moving averages. He gave a very simple way to calculate his MAs.
Getting out my Bull/Bear book (I still like to browse this every so often) he describes how to calculate it....
"A 30-week MA is simply the closing price for this Friday night added to the prior 29 Friday weekly closings. Divide that figure by 30 and the answer is what's plotted on this week's chart." So this is the calculation for a simple moving average whereas according to my wonderful book "Encyclopedia of Technical Market Indicators" by Robert w. Colby to calculate an EMA all you do is ....
"The EMA requires numerical values for only two data periods: the most recently available raw data and the immediate past period's EMA."

As all this stuff had to be individually calculated for every chart every week back then, one would think the EMA would be easier to calculate. However, I guess he preferred the SMA.
For years I have had the 30wsma and the 10wsma on my weekly charts. I have put up the 30wema just as a comparison but really the difference is negligible. I find the price does not ride the 30wma as well as it rides the 200dsma. The 30wma of both simple and ema give false flags of a fail. Over the years I have found the 200dsma to be where the best reactions occur as well.

Having said that, I really don't think it matters a whole lot which MAs one uses. It is only an indicator after all. I played around with Fibonacci numbers for a while. I use the 50 and 200dsma because that is what is set as standard on Stockcharts, so I am just trying to stay within the herd.

PAN weekly MAs 12.1.22.png


And for those interested in the two books I mentioned...


Stockybailz, thank you very much for offering a suggestion, I love looking at new things and it may well have been something I had not considered, so I really appreciate your comment. :xyxthumbs
Ann thanks for the heads up, appreciate it. Good to see you are well accomplished in your trading. Got me thinking, I should consider reading those books. I'm sure others reading this thread would be more then interested. Thanks again. (Insight to technical chart trading)
 
Ann thanks for the heads up, appreciate it. Good to see you are well accomplished in your trading. Got me thinking, I should consider reading those books. I'm sure others reading this thread would be more then interested. Thanks again. (Insight to technical chart trading)
...and I appreciate your contribution, who knows how many people are now going to look at the 30wema, and possibly Weinstein, awesome! Please come back any time.❤️
 
The next one is CKF. I found this on a list of holdings of VHY back in 2020. The chart didn't inspire me, it looked like it was in a consolidation phase, I was after a bit of growth along with some divies back then. The next time I looked back in June '21 it looked like a bit of a bubble too far from the 200dsma. Recently I looked at it again and I see it plummeting back toward the 200dsma and the rising support line from mid March '21. So far it has displayed higher lows and higher highs, works for me I thought, so worked out a price I wanted to bid $12.05 just above the rising support and 200dsma. Later in the afternoon, it filled. Good, I thought, then I saw the news reports about KFC having supply chain problems and not having a full menu. Awesome I thought, here comes d'pain. It may well fall to the pivot level of $11.00. Tuff, I will just suck it up, it will pay me some rent with its divie while I wait for a recovery.

Although perhaps it will hold the 200dsma, let's see.

I should add this is one of your Warren Buffet sort of stocks for me, in as much as I like the product very much as it is the most protein intensive T/A food, too much starch makes me really crook, so having KFC is a really tasty treat which does no harm.

View attachment 135689

for what it’s worth I think this is a terrible trade on many levels
Just not a trade I’d be interested in
many many more high potential trades
BRN CXO to name a couple.
a 200 M/A is just an average of numbers means bugger all.
 
Top