Australian (ASX) Stock Market Forum

KISS Trading with Ann

Sorry folks, no time to chat today, shall return shortly and catch up, in the meantime a couple more stocks added to the two I bought this week, I had intended to be buying more but got caught up with other stuff. Nothing that can't wait.

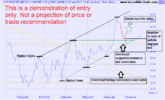
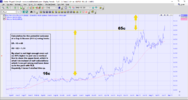
First is SMR, found this on my research for coalers some time ago, saw it was taking over BHP coal interests, felt it may join the coal establishment. It is very volatile currently so I am expecting to have to ride this like a bucking bronco. I would rather be tossed around than chase it if and when it breaks loose, it feels like a tightly wound spring. As always with my stocks I pull back for a full view of its listed chart history and what do I see on the 15-year setting? A wonderful very, very long term Cup & Handle pattern formation. So @Sean K, it is not only gold that is displaying this deliciously bullish pattern, but black gold as well! :D
SMR C&H buy 14.1.22.png

The other stock I bought is actually a rule breaker for me. It is only a tiny baby on the charts which still is not old enough for a 200dsm these I would normally never buy. However Best and Less has been around for a long time, they have baby clothes and womens' clothing well into the plus sizes. They don't have special designs for the bigger ladies, they just enlarge the pattern. I think this is an excellent idea as skinny lady clothes always look like prettier designs, so now the big lady can indulge in the same styles. There is much more to the company than this of course.

My chart explains what I am seeing there. I may have to sit out a consolidation period as it has had a good run, it could also fall back into the lower channel of $3.80/$4.20 as well, that's OK with me, I think there is a deal more upside for BST to come. No doubt it will be added to the 300 index pretty quickly and I think they are planning a divie, so happy with all that.
BST buy 14.1.22.png


Now to this weeks Doovie window...
doovie 14.1.22.png
 
FMG became a great buy from a bad prospect ( technically ) Take a look at the thread if interested.
Come on John! It was a bloody awesome prospect technically. I was about to enter before I got sidetracked by you back in the day and lost concentration, we were in deep discussion technically, I was desperately trying to convince you of its technical merits. In the meantime I missed a dream trade, never did enter FMG, my fault I should have just told you back then to fook orf but fool that I am I tried really hard to make you see what I could see on the chart!

Here are a couple of my charts from back then. Higher lows, higher highs, it was actually a technical dream, for me anyway. Do I mourn the lost trade or even care? Nup! Like blokes, plenty more where they came from! :happy:

fmg entry jan 19.png

FMG fibbo 30.1.19.png
 
I'm not real sure about what's going on. But Ann, how could you trade a stock at such a loss. Sure its activity has hit your support of 50ma, but who's to say it will bounce back to $14. I'm shocked at your impression. A fun trade indeed. i see you take the gamble that its exhausted at $12. I still say a 30wk m/a should be on order. i'm sorry to see your trade, what are the fundamentals...Don't you get frustrated...Interesting to see your philosophy go to work? You will be lucky to get 10%?

I have no problem sucking up the pain of a stock trading at a lower price than my purchase price, as long as it remains within my parameters of toleration.

I don't use the 50dsma other than for a golden cross signal. Although when I was discussing FMG with @Skate over on his Dump It Here thread recently it got me thinking now I am retired and have more time on my hands, I may look at shorter-term trades using the 50dsma as an entry signal and possibly use the 200dsma as a potential exit. Not sure if I want to do that yet. Recently AGL would have been a cracker using the 50dsma as an entry signal but I am still in the long term investor mindset. I am waiting to see if AGL falls back and begins to range trade, if that happens it could be a long and tiresome wait, may not as well, it may turn out to be an awesome trade I missed, meh!

I see CKF as a failed trade if it fails $11 not $12

I added the 30wema (green line) to the daily chart for your interest. I find it is moving too quickly as an indicator for an entrance, there would be mucho pain waiting for it to find its support level if bought in at the price cross level of the 30wema and it is also running too far away from my drawn rising support. So, no not for me. But if it works for you then I would be the first to encourage its use. It is a very personal thing.

I do very little on the fundamental side. I look at what it does, I look at its net profit and turnover and I glance back over the notices for a few months, look at who the major shareholders are but that is about it. I do very little fundamental analysis other than those things.

I never get frustrated, I love business and companies and charting. It is a never-ending source of fascination and has been since I was about eleven or twelve and read John Galbraith's book 'The Great Crash of 1929'. I was totally hooked on business from that time on. I still own that very book!

As far as the return I am likely to achieve, probably more than 10% looking at the calculations of a swing trade.

CKF swing trade 17.1.22.png

 
As far as the return I am likely to achieve, probably more than 10% looking at the calculations of a swing trade.
Hold your head high! Your an accomplished trader. The 30ema, should be considered as a Trend signal, and looking at the chart its doing all sorts of weird and wonderful things. My only criticism would be that it falls in a sharp decent. The 50sma is strong hold. Going by your analysis, CKF should correct its self any day now. I mean look what happened feb/mar 20 it fell considerably, but bounced back. Of course that's a completely different scenario. I wouldn't let it run to far from there, as you said $11 is a failed trade. Thanks for the book (b00kmark) All the best!
 
Last edited:
Look on the bright side your doing well (early days) 5/8 trades all in green yesterday a promising start to the week. 7/8 trades in the green today. AKE up on top of Lithium news it may surge. CKF may be correcting itself today, If you ask me your got some amazingly good apples in your tree...
 
Look on the bright side your doing well (early days) 5/8 trades all in green yesterday a promising start to the week. 7/8 trades in the green today. AKE up on top of Lithium news it may surge. CKF may be correcting itself today, If you ask me your got some amazingly good apples in your tree...
Time will tell Stocky, a strong hurricane can blow off the best of apples from a tree, in fact the whole tree may be swept away. Time will tell.
CKF

Well eat my pajamas
Not so fast John, this may all unravel in a sea of tears.... :happy:

Let's take a look and see if I lost any roof tiles. All my holdings are within my tolerance levels, so all good this week.
The worst performer was poor little BST. I am not surprised being so young it is very thinly traded. I broke a rule, I deserve the pain.
It is down 10.45% I was well prepared to see it down to these levels and lower. It bounced off $3.80 support. Let's see if this is a level that will hold. As far as CKF is concerned it has not broken $11, so still good.

BST bounce 21.1.22.png

I didn't need to sell any of my KISS holdings this week but I did sell one of my older holdings on Thursday ETF HEUR. It broke below the 200dsma after a build-up of a series of resistance lines. I may come back to this at some later stage but it would need to overcome all those resistance lines first. Further explanation on the chart.

HEUR sell 21.1.22.png
 
I bought the last two stocks for the KISS thread this week, not the most ideal entry points, I didn't wait for my sweet spot bounce. So feel the pain girl! :blackeye:
One was A4N because I wanted another Aluminium stock and it appeared to have a sort of Cup & Handle pattern and the other was the ETF BNKS. This holds banks ex Australia. I may or may not have made a mistake with this one but let's see. I liked the three higher highs, the three higher lows and the lift above horizontal resistance.

A4N buy 21.1.22.pngBNKS buy 21.1.22.png
 
I bought the last two stocks for the KISS thread this week, not the most ideal entry points, I didn't wait for my sweet spot bounce. So feel the pain girl! :blackeye:
One was A4N because I wanted another Aluminium stock and it appeared to have a sort of Cup & Handle pattern and the other was the ETF BNKS. This holds banks ex Australia. I may or may not have made a mistake with this one but let's see. I liked the three higher highs, the three higher lows and the lift above horizontal resistance.

View attachment 136396View attachment 136397

You'd like the right lip of the cup to be a bit higher and the handle to not go so deep (I think a 50% retracement is the guide), but I think with imagination, you're on the mark. It's probably already reached it's projection from that set up though?
 
I am sure a number of us have found this a slightly uncomfortable week, never my favourite sort of week as I need to pay really close attention to all my stocks of which I have a number. Much more work than normal. Hopefully, this will resolve itself soon as a number of my stocks are more recent purchases, so less area for buffering. I may lose money but I will not bail before my tolerance parameters are broken. I didn't get a whole lot from Peter Lynch's book 'One Up on Wall Street' but what I did get was an invaluable quote...

“Far More Money Has Been Lost By Investors Preparing For Corrections, Or Trying To Anticipate Corrections, Than Has Been Lost In Corrections Themselves.” – Peter Lynch.


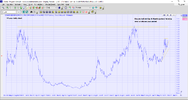
During these highly volatile days, there are a couple of charts I refer to just to get a bit of perspective one of them is the CBOE Total Put/Call Ratio ($CPC)

I see it like an overbought/oversold signal, similar to the RSI. Looks fairly oversold to me but it could go higher.


$CPC 21.1.22.png
 
“Far More Money Has Been Lost By Investors Preparing For Corrections, Or Trying To Anticipate Corrections, Than Has Been Lost In Corrections Themselves.” – Peter Lynch.

Agree. I've read other analysis along those lines. And, there's some stats about investing at the top of the market before a crash and you redeem your money in X amount of time if you just hold on. As long everything you'd invested in didn't go bankrupt, so it might depend a bit on your asset allocation and time horizon.
 
Agree. I've read other analysis along those lines. And, there's some stats about investing at the top of the market before a crash and you redeem your money in X amount of time if you just hold on. As long everything you'd invested in didn't go bankrupt, so it might depend a bit on your asset allocation and time horizon.
including ( real ) inflation ??

i suspect the answer is sometimes

PS i factored in 10% company failure ( over the years ) when first formulating my plan at the end of 2010 ( SO FAR , i am beating that but the end of 2022 might tell a different outcome )
 
including ( real ) inflation ??

i suspect the answer is sometimes

PS i factored in 10% company failure ( over the years ) when first formulating my plan at the end of 2010 ( SO FAR , i am beating that but the end of 2022 might tell a different outcome )

Not sure. Just based on the indices I think.
 
i would be surprised if anyone has done that calculation with real inflation when using CPI is so government acceptable

Japan is a fairly easy example of NO , but is it unique , could there be other examples

( obviously 'real inflation' data is hard to find in several countries , but what of others )
 
You'd like the right lip of the cup to be a bit higher and the handle to not go so deep (I think a 50% retracement is the guide), but I think with imagination, you're on the mark. It's probably already reached it's projection from that set up though?
Loving your new avi Sean! ?

I never use other people's guides, I have always only ever eyeballed it. I look at something and go, yeah near enough!
However, being only half a cup I am not sure I can claim it to be one nor am I confident it will resolve as a Cup & Handle.

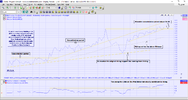
I foolishly tried to do a simple swing trade calculation as my chart doesn't go up high enough for this chart to just drag the calc line and sit it on the breakthrough horizontal.

I worked it out to be a potential outcome of $1.14, subject to correction! ?

A4N SW calc21.1.22.png
 
Top