Australian (ASX) Stock Market Forum

January 2025 DDD

Joined
13 February 2006
Posts
5,103
Reactions
11,613
Oil News:

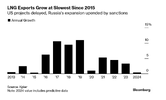
Global LNG exports grew at the slowest pace since 2015 despite natural gas demand being forecast to grow by around 2.5% this year, with limited capacity additions adding to pricing pressures seen across the year.

- Annual LNG shipments will total 414 million tonnes of LNG in 2024, up a marginal 0.4% compared to the previous year, with the United States posting the same 87 million tonnes as it did in 2023.

- Production ramp-up at two new US liquefaction terminals should boost LNG trade volumes next year, with Venture Global starting up Plaquemines last week and Cheniere producing first gas at Corpus Christi on Monday.

- Russia’s LNG ambitions were derailed by US sanctions that debilitated the 19.8 mtpa Arctic LNG 2 project, therefore Qatar would be the closest competitor of the US as it aims for a 2026 launch of the supergiant North Field East expansion project.

Market Movers

- Portugal’s oil firm Galp Energia (ELI:GALP) reported a fourth light oil reservoir discovery at the Mopane prospect in offshore Namibia, boosting hopes it could genuinely hold 10 billion barrels.

- Colombia’s state-controlled oil firm Ecopetrol (NYSE:EC) agreed to buy the remaining 45% share in Colombia’s CPO-09 onshore block from Spanish peer Repsol (BME:REP) for an undisclosed sum.

- Italy’s oil major ENI (BIT:ENI) started the second phase of the Baleine field in offshore Ivory Coast, adding 60,000 b/d in production capacity and effectively doubling the country’s total output.

Tuesday, December 31, 2024

The last quarter of 2024 will go down as one of the most rangebound predictable trading periods in recent history as oil prices traded within a very narrow bandwidth, between $71 and $81 per barrel, for three months that have seen a high-impact OPEC+ meeting, Trump’s re-election, and continuous Chinese doom. ICE Brent futures will end the year at $74 per barrel, a $1 per barrel increase month-over-month, in extremely thin trading.

Puerto Rico Wakes Up in Darkness. Electricity supply across the island of Puerto Rico has collapsed as more than 90% of households were without power on New Year’s Eve, with lack of investment into post-hurricane infrastructure recovery leaving only one back-up plant generating energy.

Cheniere Hits New LNG Milestone. US LNG developer Cheniere Energy (NYSE:LNG) announced it produced first liquefied gas from Stage 3 of the Corpus Christi LNG project, with full commissioning of the 1.5 mtpa capacity Train 1 of the liquefaction facility expected by March 30 next year.

White House Protects Nevada from Drillers. The Biden administration approved a request from the US Forest Service to withdraw 264,442 acres in the Ruby Mountains of northeast Nevada from oil, gas and geothermal development for 20 years, less than three weeks before Trump’s inauguration.

Iraq Greenlights Key Infrastructure Project. The Iraqi government sanctioned the 2.25 million b/d Basrah-Haditha oil pipeline project that would finally connect oil fields in the south of the country with central regions around Baghdad, with a preliminary price tag pencilled in at $4.6 billion.

Russia to Stop Exporting Gas to Moldova. Russia’s gas major Gazprom said it would suspend all pipeline gas exports to Moldova on January 1 due to the country’s unpaid debt, assessed around 710 million, putting an end to some 2 bcm per year of supplies that have been piped via Ukraine.

Beijing Wants More Fuel Oil Levies. The Chinese government plans to raise duties on imported fuel oil from 1 January 2025, lifting the levy from 1% currently to 3%, adding approximately $2 per barrel to the cost of imports for refiners as many used Russian and Iranian fuel oil to replace crude.

Airlines Stocks Rebound from COVID Slump. US airlines have been one of the top stock performers in the energy space as the S&P Supercomposite Airlines Index jumped 60% in 2024, double the annual gain in the S&P 500 Index, with US travel activity beating all previous records.

Hedge Funds Get Bullish Again on Oil. Bullish bets on oil reached a 4-month high after hedge funds and other money managers added their long positions by a further 21,694 lots in the week ended December 24, positioning themselves for potential price spikes as Trump returns to office.

Europe Braces for Cold January Weather. European gas prices have soared to €49 per MWh as the Russia-Ukraine transit saga drags on and weather forecasts indicate a sharp drop in temperatures across Northwest Europe in early January, with the cold snap potentially persisting all next month.

Australian Output to See Plunge in 2025. Australia’s leading oil producer Santos (ASX:STO) will decommission the Ningaloo Vision FPSO next year, putting an end to production at the heavy Van Gogh, Coniston and Novara offshore fields after less than 15 years in operation.

Nigeria’s Refineries Keep on Coming Back. Nigeria’s 125,000 b/d Warri refinery has resumed operations after a decade of shutdowns, initially blamed on dilapidation and crude shortages, the second NNPC-operated downstream asset in the country that was brought back to life in 2024.

EV Battery Costs Collapse on Cheap Metals. The raw materials bill for an average EV battery now stands around $510 compared to $1900-2000 at the beginning of 2023, driven by lithium’s 75% plunge but also boosted by declining prices for cobalt and nickel, down 34% and 25%, respectively.

Top Performer Cocoa Set to Rise Higher. Cocoa, the best-performing commodity of 2024 boosting an annual gain of 175%, is set for further growth in 2025 as farmers in Ivory Coast, the world’s largest cocoa producer, reported a deterioriation in crop quality amidst intense rains and Harmattan winds.


  • Over the past two weeks, Nasdaq 100 futures have coiled into a tight Triangle pattern, setting the stage for a meaningful resolution in either direction as we enter the new year.
  • Clearing 22,222 would confirm a breakout, while violating 21,000 would confirm a breakdown. Either way, the Nasdaq is nearing a decision point.
  • Consolidation patterns typically resolve in the direction of the underlying trend, which, in this case, is higher. However, when they don't, it often indicates trend exhaustion.
The Takeaway: The Nasdaq 100 is coiled up for a big New Year's resolution.

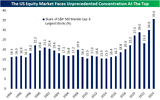
On Friday, we published our annual recap report for 2024. The report provides a complete rundown of everything that went on across financial markets this year, including the trend of incredible concentration in stocks up at the top. Replicated below is a chart from that report showing the combined market cap of the S&P 500's eight largest stocks as a percentage of total S&P 500 market cap for each year going back to 1994.

Currently, the eight largest members of the S&P—at the moment those are the Magnificent Seven names plus the newest trillion-dollar stock: Broadcom (AVGO)—account for 35.6% of S&P 500's total market cap. That's a record high. We would also note that the growing share of the S&P 500's market cap that this small handful of stocks accounts for isn't exactly a new phenomenon. Over the past decade, the largest stocks' share of market cap has steadily been growing, and actually, this isn't the only record high to highlight with prior records being set at 29% at the end of 2021 and 30% last year. With that said, the 5.6 percentage point jump versus last year is one of the largest one-year increases in concentration at the top that we've seen.
123024-Largest.png

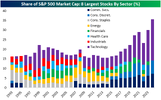
Drilling down a step deeper, below we again show the collective share of S&P 500 market cap possessed by the eight largest members for each year since 1994, but this time with a breakdown by sector. Of the current group of largest stocks, half belong to the Tech sector: NVIDIA (NVDA), Apple (AAPL), Microsoft (MSFT), and Broadcom (AVGO). Of course, zooming out for context, the Tech sector, as a whole, holds a historically massive S&P 500 weighting at 32%, but these four stocks alone account for a huge share (21.5 percentage points) of that. In other words, the S&P 500 is heavily concentrated in Tech, and Tech is heavily concentrated in these four stocks.

As for the other largest members, Communication Services names—Meta Platforms (META) and Alphabet (GOOGL)—account for a combined 7.21% of the S&P 500's total market cap and the remaining two names from the Consumer Discretionary sector—Tesla (TSLA) and Amazon (AMZN)—are to thank for 6.95%.

As for the rest of the sectors, 2024 is going to end with Financials not having a single stock in the eight largest S&P members for the first time since 2009. This is thanks to Broadcom (AVGO) unseating Berkshire Hathaway (BRK.B) as the index's eighth largest stock. Meanwhile, Industrials hasn't had a stock land in the top eight since 2015, and Consumer Staples has now gone a decade without a top eight stock. In the past five years, Health Care has only found its way into this group once in 2022, but otherwise, it has been absent. Materials, Real Estate, and Utilities haven't had a member land in the top eight largest stocks in any year since at least 1993.
123024-Largest-2a.png

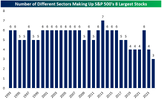
Again, the present situation is historic. Aside from there never having been such a large share of the S&P 500's market cap coming from the top, there also hasn't been a year since at least 1993 when these top eight stocks have had such narrow sector representation. As shown below, only three sectors are represented among the S&P 500's top eight stocks. Historically, it has been most common to see six different sectors represented among these eight names.
123024-Largest-3.png


Screen Shot 2025-01-01 at 7.55.29 AM.png

Full:https://www.wsj.com/finance/investi...b?st=caNkg6&reflink=desktopwebshare_permalink
Screen Shot 2025-01-01 at 7.49.15 AM.pngScreen Shot 2025-01-01 at 7.49.34 AM.pngScreen Shot 2025-01-01 at 7.53.32 AM.pngScreen Shot 2025-01-01 at 7.53.42 AM.pngScreen Shot 2025-01-01 at 7.54.18 AM.pngScreen Shot 2025-01-01 at 7.54.34 AM.png

Screen Shot 2025-01-01 at 7.58.47 AM.png

A pretty good year for the bulls.
Screen Shot 2025-01-01 at 8.00.43 AM.png

jog on
duc
 
Tom Lee:


jog on
duc

time will tell , i think the serious ( spare ) money is still watching and waiting ( or still on vacation )

now the guys/gals who are active traders they will be looking at their leverage risk ( if any )

that input of cash might all go into downside bets ( where if successful they can change tack quickly and harvest any retail support , after all they are normally quicker to react )


Mr divs,

Passive flows = $1.5 billion/day into stocks. Of course the higher the market goes, ie. MSFT etc, the less effect this actually has. However that being said, when flowing into a BTD, then it has a greater effect.

At some point however, the math reverses. That point is when the passive instead of buying asks to sell.

Then those passive flows reverse taking the market far lower than it otherwise might have if we had an actual 2-way market where 'value' was actually part of the decision making process. Value is way lower in any case.

Another 1000 S&P points to 7000 and that $1.5 billion may no longer be enough to keep lifting the market higher.

A recession with materially higher UE and that $1.5 billion shrinks. What does $500 million do?

jog on
duc
well i class 'passive' ( perhaps wrongly ) as 'dumb money ' it automatically goes into the market without a thought about timing , value or even ROI and certainly seems oblivious to inflation ( just park that damn money NOW )

that is very different from an 'old school' conservative fund manager who ( should ) thinks very carefully about the clients cash being injected into the market , and does so with caution

now outflows might not react in a logical way ,

how many funds will allow speedy withdrawal of cash , and if we took the Australian Super System as an example SOME cash will still go automatically into the market ( suggesting some sort of buffering effect on the way down , and that is assuming that some retail folk will not buy the dip , which many are now accustomed to doing )

now of course the SMSF folk are completely different they have more and more rapid actions open to them ( rush into 'reverse index ETFs , rush into cash , gold and gold substitutes etc etc or just STOP putting new cash into the market (if you were buying BHP when it was $15 would you be in a hurry to sell now ? , as an example )

now a market crash is horrific IF leverage is involved ( and it often is at the BIG end of town )

so with 'passive index' funds how much of it is available for speedy liquidation , that might be key question ( government might step in and restrict outflows especially if the big boys have leveraged those funds 3 and 5 times over )

so IF there is a major crash will the government ( openly or covertly ) step in to calm the fuss .. say close the markets for week ( or backdoor lines of credit to selected funds/banks )

however at retail level , i suspect the retail folks will be left to bleed out ( if cut badly )

by the way , i consider 'value ' as returns on investment ( not specifically potential capital gains )

now of course the boogie man that seems to have vanished ( currently ) is unrealized capital gains tax , if that were bought in , the game would completely change ( maybe even the whole government structure would change ) then you would have a LOT of forced selling

hey the idea had traction with 'that other mob ' ( that rules for thee NOT for me cult ) it MAY come back ( but not evenly and fairly )


jog on
duc

big crash OR selective life-lines ( and selective 'circuit-breakers' )

i only read about the GFC in hindsight ( i had a LOT of stuff going on the the GFC , i was completely distracted )

but 2020 i did get to watch ( and learn ) i suspect 2020 on steroids will be the most likely scenario ( unless the public is so outraged they can't get away with 'saving their mates' )

but gee how do you prepare , if it BIG crash happened TODAY i would still be struggling to ( mostly ) liquidate , my internet connection is a real snail ( considering it is NBN wireless broadband .. allegedly 100mb/s )

( one reason i never tried deliberate trading , not even weekly holds )


So the 2008 debacle was the most talked about short from about late 2006 and earlier for many. The media make out it was a surprise and only the smart few were on this. Nonsense, the mortgage resets on subprime were well known. I was having arguments with Mr fff about which banks to short.

2020 was signalled by the Repo Market blowout in 2019 and I highlighted that on the day. So when 2020 occurred, I was ready for it.

This current market has all of the hallmarks of multiple bubbles. It will have severe issues. Timing of course is the issue, which is why preparation is key.

I'm ready.

How you like to play the bear is of course individual.

The market pundits are all over the place, higher, lower, etc. The fundamentals are bad. But they are not a timing tool. Charts are unreliable, but give you a probability.

The best I have found is a Quant mixed with charts.

Anyway:

The no coiners are back.

Have you noticed how every chance they get, they'll try to convince you that this is a major top for Bitcoin and the ponzi scheme is officially over?

The no coiners are angry like that. Imagine what it must be like to not have owned Bitcoin this entire time? Ouch.

Here's the "historic top" they're trying to scare you about.

You tell me, does this look like the end of a major bull market, or does this just look like a normal healthy consolidation within an ongoing secular bull market?
1735779239352_btcusdnow_01JGJ82J45PW4D5VS8TDGVF7G2.png

There are opportunities in this space whether you trade Crypto currencies or not.

You've got the ETFs that track the price of Bitcoin and other tokens. You have the Crypto Miners like MARA and RIOT and others, which have presented us with several year-making opportunities this cycle.

And of course, you have the infamous Microstrategy $MSTR, where Michael Saylor continues to buy more and more Bitcoin with every rally or dip. He does not discriminate. He just keeps on buying.

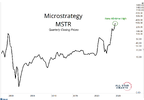
Here's a zoomed out look at Microstrategy so you can see this was just the highest quarterly close in the history of the company, even dating back to before the dot com bubble:
779601083_mstr%20nownow_01JGJ8DKB230YQZGMWV0MYCNGT.png

The market doesn't promise us much. But the one guarantee that the market does make is that there will be more opportunities in the future.

That we know for sure.

And while I don't exactly what those opportunities will be a month from now, or 3 months from now or even next Fall, I do know for a fact that there will be trades to be made with very asymmetrical risk vs reward propositions.

That's all we can ask for.

I will personally be walking through the current opportunities in the market this Monday during our first LIVE Monthly Strategy Session of the new Year. Click here to sign up and join us.

Our research and trade setups are tailored for any market so you're prepared for bullish, bearish, or choppy action. All Star Charts Premium has you covered with:
  • Actionable insights on major trends, sector rotations, and seasonality.
  • Our proprietary Rangefinder App, giving you real-time access to trade ideas.
  • Live member-only calls, where we dive deep into setups and strategies.
  • Full access to my 12-part Mastermind series, packed with the tactics I use every day.
Don’t let another year go by wondering what could have been.

Everything moving higher today except stocks which are meh

Screen Shot 2025-01-03 at 6.01.30 AM.pngScreen Shot 2025-01-03 at 6.01.14 AM.pngScreen Shot 2025-01-03 at 6.03.18 AM.pngScreen Shot 2025-01-03 at 6.02.49 AM.png

Screen Shot 2025-01-03 at 6.06.16 AM.png

Now this is interesting.

Screen Shot 2025-01-03 at 6.07.45 AM.png

Liquidity (starting) again to be an issue?

We know where that liquidity has come from previously. We also know it's near exhausted.

Screen Shot 2025-01-03 at 6.09.47 AM.png

Who will soak up the supply?


jog on
duc
 
@ducati916 Please elaborate on the $MOVE Ice MOVE index and its direction/change.

gg


Mr GG,

The $MOVE is the volatility index for the Bond market. Up = more volatile, down less volatile.

Politics:

The outgoing Biden administration has pointed to its investments in U.S. manufacturing as signature economic achievements. One big question now is how much of that the new Trump administration will change or scrap.

  • As it happens, an 11-month-old paper offers a preview.
Why it matters: The man tapped to be President-elect Trump's top White House economist published a detailed critique of President Biden's industrial policies last February. It offers a sense of the strategies for reindustrializing the U.S. economy sought by those with the president-elect's ear.

  • Stephen Miran, Trump's designee to chair the Council of Economic Advisers, argued that industrial policy should focus on supply-side reforms that make it easier for companies to invest in factories, and be driven by demand from the defense industry.
  • He is critical of heavy subsidies for electric cars and labor, environmental, and other regulations that, in Miran's view, make the U.S. too inhospitable to manufacturing.
What they're saying: "Bidenomics not only imposes onerous costs on industry in various ways — from incentives for unionization to special environmental restrictions — that raise the cost of production and work against the stated goal of expanding our industrial plant," Miran wrote for the Manhattan Institute, where he is an adjunct fellow.

  • "[It] does so while targeting sectors of the economy for which there would be very little demand, absent government support to artificially lower prices," he adds.
  • "A more robust form of reindustrialization would instead combine aggressive supply-side reform with demand support from defense-driven procurement," he wrote, "which would produce enormous positive economic spillovers."
Zoom in: Among other specific policies he critiques as counterproductive are EPA rules governing chipmakers, the Davis-Bacon Act (which includes wage requirements for public projects) and Occupational Safety and Health Administration rules on worker safety that he argues go overboard.

Flashback: Biden has made revitalizing U.S. manufacturing central to his domestic agenda — and his political identity.

  • His signature legislation — the Inflation Reduction Act, Bipartisan Infrastructure Law, and CHIPS and Science Act — were meant to deploy hundreds of billions of dollars to encourage domestic manufacturing.
  • But even some allies were critical of a thicket of rules attached to those dollars that may have made it cumbersome for manufacturers to take advantage. For example, chip manufacturers are required to make child care accessible to employees.
  • On net, manufacturing employment is not meaningfully higher than it was before the pandemic (12.9 million jobs in December, versus 12.8 million in February 2020).
Reality check: Miran's will be one voice among many seeking to influence Trump on industrial policy, and the CEA job is more advisory than responsible for carrying out programs.

  • Much of the policy detail of the Biden-era legislation is carried out by the Commerce Department, Treasury Department, and others.
  • Should Trump seek to change or repeal the laws, it will require action from a closely divided Congress in which many Republican states have benefited from the investments.
Oil News:

The gradual return of oil market participants from the New Year’s Eve holidays has been marked with tacit optimism as US stock draws tightened product availability just as cold snaps are threatening both Europe and the US. Meanwhile, China’s vows to be more proactive with stimulus measures have lifted the spirits of those who gave up on more robust policy coming from Beijing, even if temporarily, pushing ICE Brent futures closer to $76 per barrel.

Biden to Ban Some US Offshore Drilling. Outgoing US President Joe Biden is reportedly preparing to issue a decree that would permanently ban offshore drilling in US coastal waters that are to be considered biodiversity-sensitive, under the 1953 Outer Continental Shelf Lands Act.

Key African LNG Project Starts Up. The Greater Tortue Ahmeyim liquefaction terminal offshore Senegal and Mauritania achieved first gas this week, with the BP(NYSE:BP) operated 2.7 mtpa project expected to load its first cargo at some point in the first quarter of this year.

Norway’s LNG Hampered by Equipment Failure. Norway’s state oil firm Equinor (NYSE:EQNR) expects its 4.7 mtpa Hammerfest LNG export terminal to be shut down at least until January 9 following the failure of a key compressor this week, halting flows from the country’s only LNG facility.

Beijing Eyes Further Curbs on Battery Technology. China’s Ministry of Commerce proposed additional export restrictions on battery and critical mineral processing technologies, with a particular focus on lithium processing in a move that could also hinder the overseas expansion of CATL or Gotion.

Indonesia Botches Biofuels Transition. Indonesian authorities have mandated a 40% mix of palm oil-based fuel in diesel sales starting January 1, but Jakarta has halted the nationwide rollout of the new biodiesel because there’s still no government regulation specifying the pace of its roll-out.

Nigeria Tightens Upstream Mandates. Nigeria will from now on require that applicants for exploration blocks show evidence of lowering carbon emissions and embracing renewable energy in line with the country’s 2060 net zero emissions target, with enforcements starting from January 1, 2025.

China’s EV Champion Posts Record Numbers. Sales of new energy vehicles from China’s largest EV carmaker BYD (SHE:002594) reached all-time highs in 2024, rising by 41% year-over-year to 4.304 million units and accounting for exactly one-third of the country’s total electric vehicle sales.

European Major Boosts Libyan Exploration. Spain’s oil major Repsol (BME:REP) has resumed oil exploration in Libya after a 10-year hiatus, drilling an exploration well in the Murzuq basin across the country’s southwest regions, following in the footsteps of ENI and BP that resumed drilling in 2024.

Diamond King Builds Up Huge Inventory. De Beers, the world’s largest producer and distributor of diamonds, has reportedly built up its largest stockpile of diamonds since the 2008 financial crisis, with 2024 annual sales down 20% on the back of weaker Chinese demand and lab-grown competition.

Nippon Steel Fails to Persuade White House. US President Joe Biden is set to block the sale of US Steel Corp. (NYSE:X) to Japan’s Nippon Steel, putting an end to a proposed $14.1 billion deal, derailed because the sale of a storied American company to a foreign competitor was deemed a national security risk.

Russia Halts Pipeline Flows via Ukraine. Following the expiry of the 5-year gas transit contract between Russia and Ukraine, Russia’s gas giant Gazprom halted natural gas supplies through Ukraine, with the halt in pipeline supplies triggering an energy crisis in Moldova and the breakaway region of Transnistria.

Nickel Hits Four-Year Low Amidst China Gloom. Nickel prices hit their lowest level since 2020 with cash settlement quotes falling below $15,000 per metric tonne as the market still waits for Chinese stimulus measures to trickle into demand dynamics, with copper seeing similar negative pricing dynamics.

US Cold Snap Lifts Diesel Prices. The Nymex ULSD futures contract rose to $2.36 per gallon this week, hitting a three-month high as forecasts indicate a series of Arctic cold snaps across the United States that should lift diesel and heating oil demand beyond seasonal patterns over the course of January.

Screen Shot 2025-01-04 at 6.49.55 AM.png

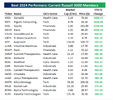
Below is a one-sentence description of what each of the 20 best performing stocks in the Russell 3,000 in 2024 does to generate revenues:
  • GeneDX (WGS): Provides advanced genetic testing and analysis to support precision medicine and healthcare solutions.
  • Rigetti Computing (RGTI): Develops cutting-edge quantum computing systems and software for various industries.
  • Sezzle (SEZL): Offers "buy now, pay later" financing solutions for e-commerce platforms and retailers.
  • Dave (DAVE): A personal finance app designed to help users manage expenses, avoid overdraft fees, and build credit.
  • SoundHound AI (SOUN): Develops AI-powered voice recognition and conversational intelligence solutions for businesses.
  • D-Wave Quantum (QBTS): Specializes in quantum computing hardware and software to solve complex optimization problems.
  • AppLovin (APP): Provides tools and services for mobile app marketing and monetization.
  • Intuitive Machines (LUNR): Focuses on lunar exploration technologies and space systems for commercial and government missions.
  • Root (ROOT): Offers personalized auto insurance powered by advanced data analytics and telematics.
  • Summit Therapeutics (SMMT): Develops innovative therapies for infectious diseases and other critical health challenges.
  • Redwire (RDW): Provides advanced space solutions, including manufacturing, infrastructure, and engineering for space exploration.
  • RealReal (REAL): Operates a luxury consignment platform for buying and selling pre-owned high-end goods.
  • NuScale Power (SMR): Develops modular nuclear reactor technology for clean and efficient energy production.
  • Candel Therapeutics (CADL): Focuses on the development of oncolytic viral therapies for cancer treatment.
  • Innodata (INOD): Provides data annotation, AI model training, and digital content services for enterprises.
  • Janux Therapeutics (JANX): Develops innovative immunotherapies designed to treat various types of cancer.
  • MicroStrategy (MSTR): Offers enterprise analytics, business intelligence software, and cryptocurrency-focused solutions.
  • Rocket Lab (RKLB): Designs and manufactures launch vehicles and space systems for small satellite deployments.
  • Byrna Technologies (BYRN): Produces non-lethal self-defense products and devices for personal and law enforcement use.
  • Palantir Technologies (PLTR): Provides data analytics platforms and solutions for government and enterprise use.

Screen Shot 2025-01-04 at 6.55.05 AM.pngScreen Shot 2025-01-04 at 6.46.52 AM.pngScreen Shot 2025-01-04 at 6.47.04 AM.pngScreen Shot 2025-01-04 at 6.47.21 AM.pngScreen Shot 2025-01-04 at 6.47.52 AM.pngScreen Shot 2025-01-04 at 6.48.03 AM.pngScreen Shot 2025-01-04 at 6.49.04 AM.png

At the end of the year, or the beginning of a new one, it's always good to reflect on the good and the bad of the past year.

Reviewing your trades can help you spot where you have to improve, and what your strengths are. From there, you can refine and optimize.

That's why I had to forward you this note from Sean McLaughlin, All Star Options Chief Strategist.

Here's what he said about 2024...

JC
Sean here,

This might be the most important piece of content I publish all year.

2024 was an epic bull market year. Yet, the way the last two or three weeks played out left a sour taste in my mouth.

But facts only: We made good money in 2024.

One of the best things I do every year is review all of my past trades to determine what drove my profits and losses.

Grab yourself a stimulating beverage and settle in:


Summary of Trades:

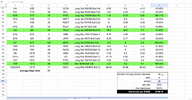
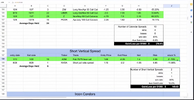
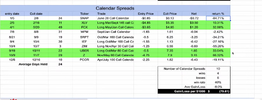
Screen Shot 2025-01-04 at 7.27.04 AM.pngScreen Shot 2025-01-04 at 7.27.15 AM.pngScreen Shot 2025-01-04 at 7.27.30 AM.png
Screen Shot 2025-01-04 at 7.26.50 AM.png

There are still summaries of less used strategies.

10 Predictions (from this guy):https://spyglass.org/10-big-predictions-for-2025/

There was a time, many years ago, when I used to do predictions for the upcoming year. Once I even won an award for accuracy!1 These days, I tend to look down at such things, as most are simply obvious year-end content filler. But here I am, on December 31, as a dad of two young children who is trying to stay up until midnight. And so it's time to fill some content. But really, I realize that most of these are too grandiose and unlikely to happen – most years are relatively boring as it turns out when it comes to what we think will happen (and far more exciting when it comes to things we'd never even think to predict) – but hitting just one would be a win, I think.

So, 10 big things that could happen this year:

  1. Apple buys an AI company – As we enter 2025, the consensus view on Apple's initial foray into AI seems to be indifferent at best and underwhelmed at worst. As Siri herself starts to get real upgrades in 2025, that could change a bit. But Apple is running a race quite slowly – too slowly – behind folks who are doing laps much faster. One way to leap ahead would be to buy a player. Apple famously doesn't do a lot of splashy M&A but perhaps an exception could be made for a Mistral or a Perplexity. Who knows if Apple would even be allowed to buy the former given their war with the EU. But the latter could be interesting in particular in light of the impending end of the Google default search deal/payments...
  2. Someone buys Warner Bros Discovery – David Zaslav clearly – clearly – wants to do a deal. But the music is slowing down and other players are already finding seats to the point where it's looking more like he won't be able to find a partner to buy as much as he'll be the one selling. Perhaps it's just some assets – CNN and/or HBO? – or maybe it's the whole thing. If the M&A environment truly is about to thaw, Comcast or someone else could make a move. Might Paramount aim to bulk up even more post-Skydance deal? And of course, I'm always trying to come up with ways for Apple to spend money, per above. It does make some sense...
  3. Intel gets bailed out – We'll see what ends up happening with the CHIPS Act under the new Trump administration, but regardless, I have a hard time believing they're going to just let Intel wither on the vine. Enabling/bolstering a true American player in chips is a win, no matter the political party. Could a new administration help broker a deal to get, say, Microsoft to support the rejuvenation of Intel? First things, first, Intel needs to put in place a new leadership team. I'll keep my (early) money on Lip-Bu Tan hereif he can overhaul the entire board as well...
  4. Elon Musk bails on the White House – I'm a bit torn on which side will sour on the other first here, but I'll go with Elon getting fed up with all the in-fighting – which we're seeing already, of course – and bureaucracy. He'll say the whole thing is f***ed and go back to trying to bring about change in his more insurgent manner, by shitposting on Xitter. There are many reasons for him to hang on as long as he can – billions, in fact – but perhaps he'll pre-empt a move by Trump here. There can be only one main character, after all. And he only shares the spotlight for so long...
  5. Amazon's Alexa overhaul proves less than "remarkable" – Not exactly shocking given all the reports and the fact that that project has clearly been delayed multiple times already. But I just have this feeling that Amazon is going to have a hell of a time trying to convince the world that a new Alexa is above and beyond the old Alexa – let alone worth paying for. Their previous success with the Echo devices is their undoing here. Might it push them ever closer to Anthropic as a result? The pieces are already in place for that relationship to be the new Microsoft/OpenAI marriage...
  6. Microsoft and OpenAI kiss and make up, or break up – It all comes down to the negotiations to turn OpenAI into a for-profit company. Assuming this happens, and Microsoft gets a massive (actual) equity stake as a result, I think that plus the continued floundering of their own consumer AI efforts will lead to a re-kindling of the relationship. Oh yes, and the fact that OpenAI still needs another $20B+ or so to make their AGI dreams come true. SoftBank and the sovereigns can help, but they still need a true American Big Tech™ partner to compete with Google and DeepMind here. If/when the for-profit status comes into effect and the relationship is rekindled, OpenAI should shoot past a $200B valuation in new tender offers. If the rift instead deepens and Microsoft and OpenAI break up in the name of independence, look for the former to be involved in a deal to buy TikTok...
  7. NVIDIA comes back to Earth, a bit – Overall, there's almost no way that Blackwell isn't a massive hit for the company. To say there's pent-up demand undersells it, and these will certainly not be undersold! But I also wouldn't be surprised if NVIDIA's overall numbers are more muted in 2025 than people may think due to supply and complexity issues. But more so I'd chalk this prediction up to the law of large numbers simply catching up with NVIDIA. They can't keep growing as they have, so simply awesome growth will have to do instead of bonkers growth. Also, what if they're not as dominant in AI inference as they have been in pre-training? And, of course, everyone – including all of their major partners – are now sprinting full speed to try to diversify away from the reliance. Still, that's probably much further off than 2025. Again, this year already seems pretty signed and sealed...
  8. Threads passes Xitter in active users – This seems to be more a matter of "when" not "if" at this point. But while early models suggested it may take a few years, Meta is seemingly getting more aggressive when it comes to growth. A few more turns of their dials and I bet they pass Xitter this year. Bluesky will continue growing too, but I don't think they will be able to compete with the growth engines and talents (and cloning capabilities) that Meta possesses – even if they're making more of the right moves in the space...
  9. Google starts to feel real pressure on search – This is a tricky prediction to make because everyone makes it every year – and has for years. And yet it's never true. But I do think that the various AI players may finally start to make some inroads here in 2025. And that could also be related to the end of the default search contracts – that will undoubtedly be tied up in courts for years, but just the threat of it may open some players – like Apple – to start to look at other options here. Perhaps this is just anecdotal, but I'm using ChatGPT for a lot more queries these days... Of course, Google could combat this with a bold placement for Gemini...
  10. Mark Zuckerberg unchained – While it all felt a bit too calculated for my taste, the "Zuckaissance" of 2024 was nevertheless impressive. But come on, this is PR 101. The media builds someone up to then knock them down. Zuck has lived this cycle a few times now and he's due to be knocked down again after a year of the press eating up the gold chains and wakeboarding. Not even sucking up to the incoming president can stop this inevitability. It's just a question of what causes the backlash. Something with Llama? Instagram? WhatsApp? Good old Facebook? Something political? Maybe flooding all our feeds with AI bot nonsense? Anyway, this knock down needs to happen in 2025 to get ahead of the next Zuck build up as the "Orion" AR glasses get closer to launch...
One more thing: My bet would be that after some strong initial buzz amongst the Apple diehards – including myself – Apple's new 'FacePod' home hub thing fails to catch on in a major way as well. Beyond people who buy everything Apple – again, that's me – it's not clear what it will be used for. Though I'm not sure how much it will matter as it's just an initial attempt to enter the home in a major way (well, beyond HomePod, I guess), but still, if it's not a hit out of the gate, there will be pressure on Apple following the fizzle of the first Vision Pro as well...

So currently the market is just chopping around in no-man's land: off the highs and off the short term lows. Trading in this environment, other than scalping day trades is a good way to reduce your account.

This might persist until Trump is sworn in.

At some point the market will move in a direction. The question is which way?

Take your best guess, no-one really knows.

Fundamentally the economy is bad. This will eventually create a bear market. That being said, it has been bad for the entirety of 2024, yet the market and several stocks moved higher. So hard out short is a dangerous bet to make: the powers that be NEED stocks higher, the stock market is their tax base. They will do everything that they can to propel stocks higher. That is a good argument to be long. However, ultimately they will lose and the market will crumble. A good argument to be short.

So I think short term we move higher. The question will be: (i) a fast top or (ii) a slow top? Both have their problems. In (i) getting out or short fast enough can be the issue. In (ii) you are fooled and don't recognise the top and keep buying long, because to date, that was the winning trade.

In the video above, again the recommendation was 'trade small'. This is also the recommendation from my Prop Firm. It is also the recommendation from TastyTrade and probably countless others.

I want to trade size: (i) because I have (leveraged) capital to do so and (ii) farting around with small positions (making hundreds, thousands of trades is somewhat boring) you want big positions that move the needle.

In 2024 I ruminated.

In 2025 I have a new strategy on paper. I have just initiated it with, LOL, small positions. However, if it performs as it should, I will size up to 100's or 1000's of contracts.

So currently I have XLF, CORZ, ACI and FCX as positions.

jog on
duc
 
Liquidity Issues:

Fed Reserves Plummet By $326BN Back Under $3 Trilion, Just In Time For Massive Treasury Cash Flood​

BY TYLER DURDEN
SATURDAY, JAN 04, 2025 - 07:25 AM
Back in October, when the repo market started cracking under the weight of the Fed's gradual reduction in Reserves and Reverses, and funding spreads briefly exploded, we quoted BofA STIR expert - and former NY Fed repo guru - Mark Cabana, who said that according to his estimates, the Lowest Comfortable Level of Reserves (or LCLOR) is around $3-3.25 trillion given "(1) bank willingness to compete for large time deposits and (2) reserve / GDP metrics (back in 2019, the repo market locked up once reserves dropped to about 7% of GDP not too far from where they are now)."

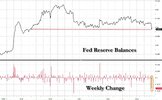
We bring this up because in the latest weekly Fed balance sheet update, we find that the amount of Fed reserve balances as of Wednesday, Jan 1, tumbled by a whopping $326 billion - the second biggest drop on record - pushing the total from the comfortable level of $3.218 trillion to $2.892 trillion, the lowest since November 2020.
fed%20reserve%20crash%202.jpg
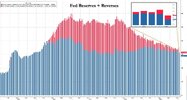
Normally, this liquidity-draining plunge would have been sufficient for funding spreads blowing out and stocks being flushed into a liquidation frenzy, however in this particular case there was a footnote: the fact that it took place at year, means that there was a mitigating factor, namely the flood of reserves went largely into reverse repos, which as we noted previously, soared by a near-record $213BN to $474BN, the highest since June, after previously dropping below $100BN.

This, as frequent readers know by now, is largely for window dressing purposes with banks scrambling to pad their books for regulatory purposes at quarter and year-ends, in the process draining substantial liquidity out of the system... then just days later reverting to normal, and sure enough on Wednesday we already saw a huge drain in the reverse repo balances, which dropped by 50%, or $233BN in one day, to $240BN, an amount which we are confident will slide aggressively, and back below $100BN, in the coming days.
fed%20reserves%20and%20reverses%20jan%203.jpg
That also explains the market's sanguine take on the recent plunge in reserves: it is quite confident the numbers will increase in the coming days.

There is another reason why what would otherwise be a concerning drop in systemic liquidity has yet to manifest itself in any funding spreads blowing out, and for that we have to thank Democrats for refusing to kick the can on the debt ceiling, which as discussed previously, will hit within days and restart the familiar 4-6 months liquidity flood that traditionally precedes the next debt ceiling crisis.
As Goldman's William Marshall writes in a Thursday note (available to pro subs), the start of 2025 brings the end of the debt limit suspension period. And while the treasury likely won't have to dip into its extraordinary measures until the middle of January, as Janet Yellen noted recently, from that point it will generally have to operate under the constraints of cash on hand plus available extraordinary measures until there is a resolution. At that point the countdown to the next debt ceiling crisis begins, and the deadline for the next D-Day, or debt limit action, is likely not until July or August 2025.
Some more details from the Goldman report:
We estimate Treasury will start out with slightly more than $1tn in headroom, reflecting the sum of the Treasury's cash balance plus extraordinary measures available up front. As Treasury Secretary Yellen noted in a letter to Congress, it likely won't be until the middle of January that Treasury actually has to start dipping into its extraordinary measures thanks to redemptions of nonmarketable securities on January 2. In addition to the capacity available to begin with, we assume some incremental headroom will come available each month alongside a more sizeable boost at mid-year.
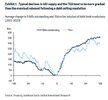
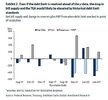
There is uncertainty as to how exactly Treasury will manage its available levers—i.e. the pace at which it draws down the TGA versus depleting extraordinary measures via higher net marketable borrowing. Still, the overall effect will be less bill supply and higher levels of broad liquidity (thanks to a lower TGA) in the system than the counterfactual of no constraint. Exhibit 1 illustrates the average change in T-bills outstanding and cash balances normalized to past debt-limit resolutions (using a sample since 2011).
bill%20supply%20decline%20vs%20cash%20goldman.jpg
On average bill supply falls by about $130bn and the TGA drops roughly $225bn in the 6 months into an agreement. The subsequent rebuild tends to be somewhat faster—on average bills outstanding and the TGA both reverse that decline within the month or two following a resolution.
As noted above, the TGA will be starting off at a considerably higher level compared to when Treasury has reached the debt ceiling in the past (highs of approximately $450BN in 2021 and 2023). Goldman expects this year's TGA drawdown to be comparable to the 2021 and 2023 experiences when cash balances fell roughly $425bn in the window between reaching the debt ceiling and resolution.
TGA%20cash%20drop.jpg
That said, a process that drags into Q3 could see TGA fall significantly further still as July and August tend to be seasonally large deficit months, and thus GS estimates meaningful bill paydowns in the $400 to $600bn range over the first two quarters in this scenario, on par with the paydown observed in 2021

Paradoxically, and as we explained in early 2021, the period preceding a debt ceiling D-Day (which will takes place some time in Q3) tends to be very beneficial for risk assets, not because markets fail to discount a potential looming political crisis, but because overall liquidity levels soar.

Indeed, as Goldman confirms, "debt ceiling limitations mean that until there is a deal there will be less bill supply and higher levels of broad liquidity than would have been the case otherwise." Less Bill supply means the Treasury is forced to draw down on its Treasury General Account (i.e. cash balances) as it can't roll Bills, and meanwhile the liquidity from maturing Bills is allocated to other risk assets lifting them in the process despite what is clearly another looming crisis.

To wit, the bank writes that "balance sheet runoff means, however, that a given TGA drawdown is likely to translate to a smaller build in overall liquidity in the system (measured as reserves plus RRP) — we expect this would rise roughly $150-250bn through mid-year under our QT baseline assuming no resolution ahead of then."

Ironically, as with the scope for a larger TGA drawdown, a more protracted process that spills into the second half of the year could see a sharper rise in overall liquidity that exceeds what was seen in 2023 when injections from the Bank Term Funding Program also helped offset the impact of QT. Conversely, a later tapering and/or end to QT than baseline expectations of an H1 end, would dampen any potential rise in liquidity although should Trump pursue an activist Fed to boost overall liquidity, we don't expect this happening. Ultimately, absent any debt limit constraint, bill supply would be roughly flat alongside a roughly $350bn draining of overall liquidity from the system in the first half of the year.

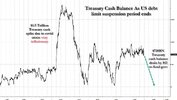
In other words, the good news is that with just days to go until the countdown to the next debt ceiling fiasco begins, the Treasury cash balance is historically high compared to past instances when the debt ceiling has been reached as discussed above, and If there is no resolution in the first half of the year, the TGA drawdown would more than fully offset the draining of liquidity via QT alongside meaningfully negative bill supply.
treasury%20cash%20drain%20jan%2025.jpg

Not surprisingly in light of this imminent liquidity flood, Goldman thinks that "the higher starting level for the TGA and magnitude of any potential bill paydown should at least support a more benign first half of the year in dollar funding conditions than would have been the case otherwise, dampening the tightening bias in swap spreads that have prevailed in prior debt ceiling episodes."

Goldman's rule of thumb is that a $100bn rise in liquidity from current levels is worth 0.5bp to SOFR-FF, while a $100bn drop in bills outstanding is worth about 0.1bp. That said, the market prices that in to a large degree, with most SOFR-FF tightening backloaded into the second half of the year...
market%20prices%20easer%20conditions.jpg
... which leaves vulnerability to a faster resolution of the debt limit (or a later/slower ending of QT). It's also worth noting that balance sheet capacity constraints (rather than the overall level of liquidity) have played a greater role in driving volatility in funding markets over the last year—these may ease now that year-end is behind us, but not because of the debt limit.

Putting it all together, Trump could not have asked for a better "debt ceiling crisis", because while Democrats have been hoping to pull the rug from under Trump as soon as he is in the White House (expect the reality of the US jobs market to be unloaded by the deep state apparatchiks at the BLS like a ton of bricks), the accelerated drain of some $750BN in Treasury cash will provide a generous buffer for risk assets to maintain their levitation well into the second half of 2025 much to the delight of the 47th US president.

Ironically, it would be the end of the debt ceiling fiasco that is bearish for markets! That's because, the Treasury tends to rebuild the TGA fairly quickly upon resolution, suggesting risks of a swift undoing of any tailwinds in funding and spread markets.
That said, the intersection of this episode with the more mature phase of Fed QT may see Treasury proceed somewhat more cautiously in eventually returning the TGA to target, however, particularly with Treasury's “steady-state” TGA target somewhat higher than it was pre-pandemic.
According to Goldman, the August-September 2019 repo crisis is perhaps the closest analog: QT had ended, and the mid-September jump in the TGA coincided with the surge in funding market volatility that prompted Fed liquidity injections. While the end point would ultimately be the same, a more gradual replenishing of Treasury's cash balance would reduce the risk of excessive volatility that could arise from quickly withdrawing liquidity from the system.
In other words, stocks - and liquidity sppoppnges like Bitcoin surge - for the duration of the TGA drain, then risk tumbles once the debt ceiling resolution drains $750BN from the market some time in Q3, and then - if the stress from said drain is too much - we get another "Not QE" from the Fed, which triggers the next inflationary shock into late 2025 and onward.

More in the full Goldman note available to pro subs.

jog on
duc
 
@ducati916 . So would I be correct in saying that the MOVE is the VIX of Treasuries/Bonds? For equity investors should one consider it as a counter indicator for stocks or does it have more significance quite apart from Bonds?

gg
 
@ducati916 . So would I be correct in saying that the MOVE is the VIX of Treasuries/Bonds? For equity investors should one consider it as a counter indicator for stocks or does it have more significance quite apart from Bonds?

gg

If $MOVE is expanding, there are liquidity issues for USD, which is bad for stocks because stocks can be sold to gain liquidity (ie. USD).

Because the US has a (-70%) NIIP position, that need for USD liquidity could collapse both Bond and stock markets at the same time.

$MOVE will give you a heads up at least where things are potentially heading.

Screen Shot 2025-01-04 at 2.05.37 PM.png

jog on
duc
 
The Retail Investors are scared to death. And that's a good thing.

We don't want individual investors too optimistic. That's when stocks sell off. It's when they're pessimistic and worried that you see the best forward returns.

Go back and see for yourself. It's all public information. These are the people we want to fade. This is the "Dumb" money, so to speak.

Dig this. The first sentiment data for the year just came out from the American Association of Individual Investors with the fewest number of bulls since April of last year.

In the middle of the bull market, they're crazy scared.

Good.

Now keep in mind, this is specifically what they're saying.

But what are they doing?

Well, the Put/Call Ratio just hit new 4-month highs. This means investors are buying insurance (Put options) at a much faster rate than they're betting on higher stock prices (Call options).

That's also evidence that they're scared. Why else would you be buying insurance at such a fast rate?

Now, what else are they doing?

Active Investment Managers (NAAIM) have on the least amount of long exposure since last Summer.

Holy crap are all these investors scared...

In the middle of a raging bull market, with the major indexes just a few points from new all-time highs!

Meanwhile, the S&P500 hit new lows yesterday. So did the Nasdaq100.

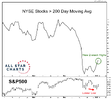
But the percentage of stocks on the NYSE above their 200 day moving average hit new 2-week highs!
nys%20above%20200%20day_01JGQCMZM1B6HWT9JGFG9D3AKA.png

This data above shows how many stocks are in longer-term uptrends, as calculated by the 200 day moving average.

Even though the indexes themselves made new lows, the number of stocks in longer-term uptrends actually increased!

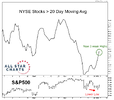
That's the longer-term look. But as it turns out, the number of stocks on the NYSE above their 20 day moving average also made new 2-week highs:
_nys%20above%2020%20day_01JGQCN03EW2KJJ9DGWBJFR32P.png

That means the number of stocks on the NYSE in shorter-term uptrends, also increased.

20 days is above a month's time.

Breadth is improving across multiple timeframes just as sentiment is getting too bearish.

What better combination do you want in the middle of a bull market?


  • Bitcoin rose for the 4th consecutive day on Friday after refusing to break the neckline of a potential Head & Shoulders Top earlier this week. If this bearish pattern continues to fail, it will likely be very bullish for the entire Crypto market.
  • While Bitcoin has stalled since reaching $100k last month, Justin reminds us that it's still breaking out relative to the S&P 500. The ratio ($BTC/$SPY) emerged from a 3-year base in November before successfully retesting in December.
  • Bitcoin will likely dominate the S&P 500 in 2025 if this ratio remains above its 2021 peak. However, both assets are trending higher on an absolute basis.
The Takeaway: Bitcoin could dominate stocks again this year, considering it's emerging from a 3-year base relative to the S&P 500.

Ever since the introduction of RRG back in 2011, many people have asked me questions like: "What is the track record for RRG" or "What are the trading rules for RRG"?

My answers have always been, and will continue to be, "There is no track record for RRG, as there is not one set of rules."

Relative Rotation Graphs are primarily a data visualization tool that can be applied to many different markets, on many different time frames and with varying degrees of risk. Most of the time, I countered these questions with "What is the track record of a bar chart?" or "What are the trading rules for a bar chart?" That said, it is possible to come up with some "rules" or "conditions" that can be tested and repeated -- in particular, two prerequisites for a quantitative and rules-based approach.

On and off over the last few years, I have been "playing around" with a few different approaches to get to something that can run objectively. This is still very much a work in progress project, but my plan for 2025 is to share the outcomes of version 1 of this approach, using the 11 SPDR sector ETFs, in this blog on a weekly basis and track the results.

I am not planning to disclose all the ins and outs of the methodology at this point in time, as this may lead to an investable product at some stage. But the basis lies in combining various weekly and daily RRG data points into one metric and create a ranking for the 11 sectors which allows me to determine the "best five sectors."

Going forward I will publish this list on a weekly basis and track the performance of a portfolio that consists of the best 5 sectors each at a 20% weight.

In the first week of 2025 this is the portfolio we start with:

  1. XLY
  2. XLC
  3. XLF
  4. XLK
  5. XLI

Screen Shot 2025-01-04 at 6.54.57 PM.pngScreen Shot 2025-01-04 at 6.55.12 PM.png

Screen Shot 2025-01-04 at 6.56.51 PM.pngScreen Shot 2025-01-04 at 6.57.42 PM.pngScreen Shot 2025-01-04 at 6.58.04 PM.pngScreen Shot 2025-01-04 at 6.58.30 PM.png

jog on
duc
 
The Retail Investors are scared to death. And that's a good thing.

We don't want individual investors too optimistic. That's when stocks sell off. It's when they're pessimistic and worried that you see the best forward returns.

Go back and see for yourself. It's all public information. These are the people we want to fade. This is the "Dumb" money, so to speak.

Dig this. The first sentiment data for the year just came out from the American Association of Individual Investors with the fewest number of bulls since April of last year.

In the middle of the bull market, they're crazy scared.

Good.

Now keep in mind, this is specifically what they're saying.

But what are they doing?

Well, the Put/Call Ratio just hit new 4-month highs. This means investors are buying insurance (Put options) at a much faster rate than they're betting on higher stock prices (Call options).

That's also evidence that they're scared. Why else would you be buying insurance at such a fast rate?

Now, what else are they doing?

Active Investment Managers (NAAIM) have on the least amount of long exposure since last Summer.

Holy crap are all these investors scared...

In the middle of a raging bull market, with the major indexes just a few points from new all-time highs!

Meanwhile, the S&P500 hit new lows yesterday. So did the Nasdaq100.

But the percentage of stocks on the NYSE above their 200 day moving average hit new 2-week highs!

This data above shows how many stocks are in longer-term uptrends, as calculated by the 200 day moving average.

Even though the indexes themselves made new lows, the number of stocks in longer-term uptrends actually increased!

That's the longer-term look. But as it turns out, the number of stocks on the NYSE above their 20 day moving average also made new 2-week highs:

That means the number of stocks on the NYSE in shorter-term uptrends, also increased.

20 days is above a month's time.

Breadth is improving across multiple timeframes just as sentiment is getting too bearish.

What better combination do you want in the middle of a bull market?


  • Bitcoin rose for the 4th consecutive day on Friday after refusing to break the neckline of a potential Head & Shoulders Top earlier this week. If this bearish pattern continues to fail, it will likely be very bullish for the entire Crypto market.
  • While Bitcoin has stalled since reaching $100k last month, Justin reminds us that it's still breaking out relative to the S&P 500. The ratio ($BTC/$SPY) emerged from a 3-year base in November before successfully retesting in December.
  • Bitcoin will likely dominate the S&P 500 in 2025 if this ratio remains above its 2021 peak. However, both assets are trending higher on an absolute basis.
The Takeaway: Bitcoin could dominate stocks again this year, considering it's emerging from a 3-year base relative to the S&P 500.


Ever since the introduction of RRG back in 2011, many people have asked me questions like: "What is the track record for RRG" or "What are the trading rules for RRG"?

My answers have always been, and will continue to be, "There is no track record for RRG, as there is not one set of rules."

Relative Rotation Graphs are primarily a data visualization tool that can be applied to many different markets, on many different time frames and with varying degrees of risk. Most of the time, I countered these questions with "What is the track record of a bar chart?" or "What are the trading rules for a bar chart?" That said, it is possible to come up with some "rules" or "conditions" that can be tested and repeated -- in particular, two prerequisites for a quantitative and rules-based approach.

On and off over the last few years, I have been "playing around" with a few different approaches to get to something that can run objectively. This is still very much a work in progress project, but my plan for 2025 is to share the outcomes of version 1 of this approach, using the 11 SPDR sector ETFs, in this blog on a weekly basis and track the results.

I am not planning to disclose all the ins and outs of the methodology at this point in time, as this may lead to an investable product at some stage. But the basis lies in combining various weekly and daily RRG data points into one metric and create a ranking for the 11 sectors which allows me to determine the "best five sectors."

Going forward I will publish this list on a weekly basis and track the performance of a portfolio that consists of the best 5 sectors each at a 20% weight.

In the first week of 2025 this is the portfolio we start with:

  1. XLY
  2. XLC
  3. XLF
  4. XLK
  5. XLI

View attachment 190476View attachment 190475

View attachment 190480View attachment 190479View attachment 190478View attachment 190477

jog on
duc
Interesting RRG idea, obviously the proof is in the pudding recipe:
how to you compute the relative strength and momentum value, then how do you twist these with weighted factors to give you an ultimate ranking number per candidate.
I like that concept , a bit different from what i played with in the past and it seems possible to backtest something on amibroker for my asx feed
Will that be enough to entice me to system trading?
Nursing a sore back from bed to armchair today, so leaving a bit of time for reflection .
Thanks for the trigger Mr Duc
 
Market predictions are silly. We all learned this a long time ago. But that doesn’t mean they’re completely worthless. Even though forecasts are almost always wrong, they can be entertaining and educational. That’s all I’m trying to do with this post. Entertain and educate. Needless to say, but I have to say it anyway, nothing in this list is investment advice. I’m not doing anything with my portfolio based on these predictions, and neither should you.​
Here is my list from a year ago. I got some right and some wrong. I expect my predictions to have a terrible track record, and that’s why I try to ride the market rather than outsmart it. So why am I doing this? Well, it’s fun to look back on what you thought was possible a year ago.​
When you see that you were so off on things, it reminds you just how difficult it is to predict the future. I also learn a lot by doing this. I uncovered some things that I didn’t know or forgot I knew.​
I’m going to change one thing up this year. Last year after I published my list, I regretted not including conviction for each prediction. In other words, do I actually believe this is going to happen? Would I bet on it? And if so, what odds would I need to place the bet? So, I’m going to include betting odds on these predictions and convert that into percentages for those of you who don’t donate money to FanDuel/DraftKings. With that, these are my ten predictions for 2024 in order of what I think is most to least likely to happen.​
  1. Private investments surge (-600/86% chance)
  2. Degens aren’t leaving. They’re not f*cking leaving. (-475/83%)
  3. Money stays in money market funds. (-300/75% chance)
  4. Mortgage rates remain high. The housing market stays frozen. (-250/71%)
  5. Nvidia to disappoint on an earnings release. Stock closes down >10% on the day. (+100/50%)
  6. VIX spike to 50 (+145/41%)
  7. MicroStrategy levered ETF blows up (+350/22.2% +3,000/3.2%)
  8. The worst performers in 24 will be the best in 25 (+400/20%)
  9. Momentum keeps going in the first half, but we have a double-digit correction in the back half and end down on the year. (+10,000/1%)
  10. Obligatory, something comes out of nowhere that makes at least half of these predictions look very dumb. (-1000/90%)
Private investments surge (-500/83% chance)
The story in private markets is a simple one. For the first few decades of their existence, alternative investments were only available to institutional investors. Given these large pools of capital have a time horizon of forever, not really but you know what I mean, it made sense to give up liquidity in exchange for the potential of higher returns. And that’s more or less how the story played out, generally speaking.​
Both the investors and the investees did well—the proverbial win-win. And over time, institutional investors increased their allocation to a large percentage of their portfolio. So large, that they couldn’t possibly grow it at the same rate in the future as they had in the past. So, these large asset managers are moving on to different berries that have yet to be squeezed.​
High net-worth investors have had access to private investments for a long time, but what’s coming next will be similar, albeit on a much smaller scale, to what ETFs did to mutual funds. The technology and customization that’s coming will make it much easier for large private asset managers to deliver solutions that work for clients, and not just those with ultra-high net worth. This is no comment on future returns. That’s another topic for another day.​
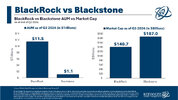
BlackRock, one of the biggest public market players, is pushing to replicate its success in private markets. I wouldn’t bet against them. The chart below paints a pretty compelling visual of what they’re going for.​
image.jpg
Blackstone, the 800-pound gorilla in private markets, had less than 10% of assets under management as Blackrock as of the end of the third quarter, but a larger market cap. It’s because the revenue is stickier, the margins are higher, and they can generate a bonus in the way of carried interest that ETFs cannot.​
We are living through a structural change in markets. Torsten Slok has a great stat showing that 87% of businesses in the United States that are generating >$100 million in revenue are privately held. Fewer companies are coming public thanks to regulation and several other factors. Investors are adapting to the new environment. This mega-trend will continue in 2025.​
Degens aren’t leaving. They’re not f*cking leaving. (-475/83%)
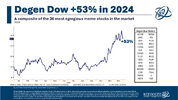
It was a good year for people who view the market as a casino. Our Degen Dow (not investable) was up 53% in 2024.​
image.jpg
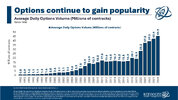
You might think that the only reason these people are gambling is because they’re pulling 21s. That’s not true. Their investments don’t have to work for them to continue playing the game. If they did, Las Vegas wouldn’t exist. Remember in 2022 when basically everything was down? That didn’t dissuade them one bit. Average daily option volume grew 14% from 2022 to 2021.​
image.jpg
People have gambled since the beginning of time. Technological advancements have brought this to the masses. The genie is out of the bottle, there’s no putting him back in.​
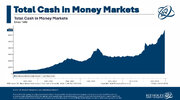
Money stays in money market funds. (-300/75% chance).
There is nearly $7 trillion sitting in money markets.​
image.jpg
The current yield on all this cash will kick off almost $300 billion in interest over the next twelve months, assuming no changes in the overnight rate (big assumption). I think inflows will slow down, but I don’t know what would have to happen for people to pull more money out than the amount that’s being generated by interest. Maybe 3% overnight rates would do it, but I don’t think they will come down that much. Cash is the most inertia-prone asset in the world. I don’t see human nature changing in 2025.​
Mortgage rates remain high. The housing market stays frozen. (-250/71%)
Out of every prediction on this list, this is the one I most hope I’m wrong about. 7% mortgage rates are dangerous for the economy and are just downright shitty for those unfortunate people who are forced to pay it.​
image.jpg
High mortgage rates have dramatically slowed sales in the existing housing market. Now new home sales are turning south soon. Because supply is so low, prices are so high and are pushing would-be buyers into renters.​
Short-term interest rates have come down, but mortgage rates remain stubbornly high. Not sure what will change this dynamic in 2025.​
Nvidia to disappoint on an earnings release. Stock closes down >10% on the day. (+100/50%)
Nvidia is up 835% over the past two years. There wasn’t a single day over that time when the stock fell more than 10%. I have no way of proving this, but I’d guess there aren’t many (any?) stocks that have ever enjoyed that type of run.​
Matt Cerminaro, who we have big plans for this year, made a beautiful chart showing how Nvidia, the actual business, has performed versus expectations. The bar kept getting raised in 2024 and they kept jumping over it. I’m guessing, actually I’m really not (50/50) that this might be the year that the pole vault falls short.​
image.jpg
If they fail to match the lofty expectations, the stock could be in for a nasty ride as investors reset expectations.​
Probably the most consensus prediction on this list, and frankly, cowardly of me to be sitting right in the middle of the fence.​
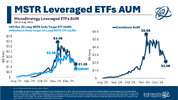
MicroStrategy levered ETF blows up (+350/22.2% +3,000/3.2%)
Michael Saylor was the face of the Bitcoin movement in 2024. His strategy of issuing equity and convertible debt catapulted MicroStrategy’s market cap from $10 billion at the beginning of the year to $65 at the end. At one point in November, it got as high as $106 billion.​
And so naturally in today’s degen investing world, it received the 2x ETF treatment. And investors piled in.​
I’m afraid this is going to end badly. I guess it already is. One of these products, MSTX, is already in a 78% drawdown. “Gee Michael, how brave of you.”​
I started this post weeks ago before it started to freefall, I double pinkie promise. Anyway, this is not the decline I was looking for. I’ll explain more in a minute.​
Victor Haghani was quoted in the WSJ “We estimate the probability of the leveraged MicroStrategy ETFs going bust in the next year at between 20% to 50%,” said Victor Haghani, who runs the investment firm Elm Wealth.​
In the same article, Dave Mazza said: “These two firms have created something that it is now clear the market can’t handle,” said Dave Mazza, CEO of competitor Roundhill Investments. “It’s really a risk to do this with options. You can’t control the market.”​
Okay, so, when I say that these levered ETFs would blow up, I wasn’t making a call on MicroStrategy itself. In fact, I was thinking its continued success would lead to its downfall. I thought, because of the size and funky nature of this structure, that it would get so big that something underneath the hood would crack and these things would nose dive 80% in a day.​
Now that it’s down almost 80% (the 2x), I think the odds of a catastrophic one-day meltdown have decreased substantially. When I started writing this a few weeks ago I had this at 22% chance. Now I think it’s down to 3%.​
image.jpg
I’m almost embarrassed to say that I’m tempted to buy this dip, but I’m not going to, which means that I probably should (definitely not investment gambling advice).​
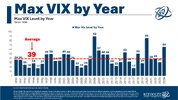
VIX spikes to 50 (+145/41%)
It’s not very bold to think that there will be a VIX spike at some point this year. Happens every year right? Wrong! I was surprised to see the average maximum VIX level by calendar year is 39.​
image.jpg
Three of the last four years have seen a max VIX spike of under 40. I think that ends this year. What causes it? Your guess is as good as mine.​
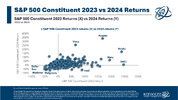
The worst performers in 24 will be the best in 25 (+400/20%)
Bespoke tweeted a crazy stat today that pairs very nicely with this prediction: The 10 worst performers in 2023 were all down again in 2024. That’s pretty wild when you consider that the index was up more than 20% each year.​
I think that changes in 2025 and I am betting on it. I’m long DLTR and MRNA, two absolute dogs. Not that you asked, but to be fully transparent, MRNA is pure speculation and the position is sized for that. If it rolls again, I’m out. I’m giving DLTR a longer leash.​
image.jpg
I 20% think some of the 10 worst performers of the last two years will be on the top 10 list this year.​
Momentum keeps going in the first half, but we have a double-digit correction in the back half and end down on the year. (+10,000/1%)
There is a high degree of difficulty on this one. Parlays usually don’t work. The market is down one out of four years, so 25% is my baseline for the latter part of this prediction.​
64% of all years have seen a double-digit decline, as you can see in the chart below.​
image.jpg
How many times has the market been up double digits through June and ended down on the year? Only once, in 1928. This surprised me too, thought there would have been a few more years on the list. So, yeah, 100-to-1 odds on this one. Any takers?​
Bonus. Something comes out of nowhere that makes at least half of these predictions look very dumb. (-1000/90%)
Ben Graham once said, “Nearly everyone interested in common stocks wants to be told by someone else what he thinks the market is going to do. The demand being there, it must be supplied.”​
Predictions are impossible. Everyone knows this, I hope.​
If you reframed the question “What do you think the market will do next year?” to “Do you think you can predict the future,” then maybe it would become more apparent how silly all of this is. Of course, nobody can predict the future. Of course, nobody knows what the market is going to do next year.​
I encourage everyone to make a list like this. It will serve as a reminder twelve months from now about how wrong you were about so many things, and hopefully, that will encourage you not to invest in a way that counts on you getting the next twelve months right.​


So my list.

1. Gold to continue its bull market, driven by BRICS use of gold as the reserve asset. Outlier: US revalues their gold to reduce debt. Every $4000/oz = $1 Trillion. So a revaluation to $12,000/oz.

2. Conversely, Trump tries the above, except unilaterally with BTC, making BTC a US reserve asset.

3. If Trump does not try to monetise BTC, then BTC price enters a bear market and MSTR blows up.

4. The $7 Trillion in debt rollovers + $2 Trillion trade deficit + continued deficit spending creates a Treasury market melt-down. The Federal Reserve is forced to intervene and return to outright QE, expanding their balance sheet. This does lead to higher inflation this time.

5. Trump unleashes Musk and DOGE. This is the Argentina playbook, ie austerity. Musk implements his DOGE before devaluing the debt (debt/gdp) and creates a sh*t storm because the USD will move higher, much higher and because foreigners were not short $13T in peso-denominated debt; they are short $13T of USD-denominated debt. Foreigners were not long $57T in peso-denominated assets, including $8.5T in Argentine government bonds; foreigners are long $57T in USD-denominated assets, including $8.5T in USTs. When the Argentine peso strengthened as a result of Milei’s austerity, foreigners did not sell peso-denominated stocks and bonds; foreigners will sell USD assets and USTs aggressively if the US implements Milei-like austerity, sending US stock prices down and UST yields up (to obtain USD) paradoxically leading to a blowout in the US fiscal deficit as a result of austerity.

6. IF US stocks fall, US deficits will explode higher as US stock market performance (higher) = tax revenue. Falling stock prices = falling tax revenues.

7. Trump surrenders Ukraine to Putin.

8. USD devalues. Much like FDR in 1933, Nixon in 1971, Trump in 2025 devalues USD by 30%.

9. This devaluation causes a bullish surge in stock prices, gold and btc if it's still in existence.

10. Duc's new strategy returns 20% on capital/month and I retire from the day job to play the market all day.

jog on
duc
 
Market predictions are silly. We all learned this a long time ago. But that doesn’t mean they’re completely worthless. Even though forecasts are almost always wrong, they can be entertaining and educational. That’s all I’m trying to do with this post. Entertain and educate. Needless to say, but I have to say it anyway, nothing in this list is investment advice. I’m not doing anything with my portfolio based on these predictions, and neither should you.​
Here is my list from a year ago. I got some right and some wrong. I expect my predictions to have a terrible track record, and that’s why I try to ride the market rather than outsmart it. So why am I doing this? Well, it’s fun to look back on what you thought was possible a year ago.​
When you see that you were so off on things, it reminds you just how difficult it is to predict the future. I also learn a lot by doing this. I uncovered some things that I didn’t know or forgot I knew.​
I’m going to change one thing up this year. Last year after I published my list, I regretted not including conviction for each prediction. In other words, do I actually believe this is going to happen? Would I bet on it? And if so, what odds would I need to place the bet? So, I’m going to include betting odds on these predictions and convert that into percentages for those of you who don’t donate money to FanDuel/DraftKings. With that, these are my ten predictions for 2024 in order of what I think is most to least likely to happen.​
  1. Private investments surge (-600/86% chance)
  2. Degens aren’t leaving. They’re not f*cking leaving. (-475/83%)
  3. Money stays in money market funds. (-300/75% chance)
  4. Mortgage rates remain high. The housing market stays frozen. (-250/71%)
  5. Nvidia to disappoint on an earnings release. Stock closes down >10% on the day. (+100/50%)
  6. VIX spike to 50 (+145/41%)
  7. MicroStrategy levered ETF blows up (+350/22.2% +3,000/3.2%)
  8. The worst performers in 24 will be the best in 25 (+400/20%)
  9. Momentum keeps going in the first half, but we have a double-digit correction in the back half and end down on the year. (+10,000/1%)
  10. Obligatory, something comes out of nowhere that makes at least half of these predictions look very dumb. (-1000/90%)
Private investments surge (-500/83% chance)
The story in private markets is a simple one. For the first few decades of their existence, alternative investments were only available to institutional investors. Given these large pools of capital have a time horizon of forever, not really but you know what I mean, it made sense to give up liquidity in exchange for the potential of higher returns. And that’s more or less how the story played out, generally speaking.​
Both the investors and the investees did well—the proverbial win-win. And over time, institutional investors increased their allocation to a large percentage of their portfolio. So large, that they couldn’t possibly grow it at the same rate in the future as they had in the past. So, these large asset managers are moving on to different berries that have yet to be squeezed.​
High net-worth investors have had access to private investments for a long time, but what’s coming next will be similar, albeit on a much smaller scale, to what ETFs did to mutual funds. The technology and customization that’s coming will make it much easier for large private asset managers to deliver solutions that work for clients, and not just those with ultra-high net worth. This is no comment on future returns. That’s another topic for another day.​
BlackRock, one of the biggest public market players, is pushing to replicate its success in private markets. I wouldn’t bet against them. The chart below paints a pretty compelling visual of what they’re going for.​
Blackstone, the 800-pound gorilla in private markets, had less than 10% of assets under management as Blackrock as of the end of the third quarter, but a larger market cap. It’s because the revenue is stickier, the margins are higher, and they can generate a bonus in the way of carried interest that ETFs cannot.​
We are living through a structural change in markets. Torsten Slok has a great stat showing that 87% of businesses in the United States that are generating >$100 million in revenue are privately held. Fewer companies are coming public thanks to regulation and several other factors. Investors are adapting to the new environment. This mega-trend will continue in 2025.​
Degens aren’t leaving. They’re not f*cking leaving. (-475/83%)
It was a good year for people who view the market as a casino. Our Degen Dow (not investable) was up 53% in 2024.​
You might think that the only reason these people are gambling is because they’re pulling 21s. That’s not true. Their investments don’t have to work for them to continue playing the game. If they did, Las Vegas wouldn’t exist. Remember in 2022 when basically everything was down? That didn’t dissuade them one bit. Average daily option volume grew 14% from 2022 to 2021.​
People have gambled since the beginning of time. Technological advancements have brought this to the masses. The genie is out of the bottle, there’s no putting him back in.​
Money stays in money market funds. (-300/75% chance).
There is nearly $7 trillion sitting in money markets.​
The current yield on all this cash will kick off almost $300 billion in interest over the next twelve months, assuming no changes in the overnight rate (big assumption). I think inflows will slow down, but I don’t know what would have to happen for people to pull more money out than the amount that’s being generated by interest. Maybe 3% overnight rates would do it, but I don’t think they will come down that much. Cash is the most inertia-prone asset in the world. I don’t see human nature changing in 2025.​
Mortgage rates remain high. The housing market stays frozen. (-250/71%)
Out of every prediction on this list, this is the one I most hope I’m wrong about. 7% mortgage rates are dangerous for the economy and are just downright shitty for those unfortunate people who are forced to pay it.​
High mortgage rates have dramatically slowed sales in the existing housing market. Now new home sales are turning south soon. Because supply is so low, prices are so high and are pushing would-be buyers into renters.​
Short-term interest rates have come down, but mortgage rates remain stubbornly high. Not sure what will change this dynamic in 2025.​
Nvidia to disappoint on an earnings release. Stock closes down >10% on the day. (+100/50%)
Nvidia is up 835% over the past two years. There wasn’t a single day over that time when the stock fell more than 10%. I have no way of proving this, but I’d guess there aren’t many (any?) stocks that have ever enjoyed that type of run.​
Matt Cerminaro, who we have big plans for this year, made a beautiful chart showing how Nvidia, the actual business, has performed versus expectations. The bar kept getting raised in 2024 and they kept jumping over it. I’m guessing, actually I’m really not (50/50) that this might be the year that the pole vault falls short.​
If they fail to match the lofty expectations, the stock could be in for a nasty ride as investors reset expectations.​
Probably the most consensus prediction on this list, and frankly, cowardly of me to be sitting right in the middle of the fence.​
MicroStrategy levered ETF blows up (+350/22.2% +3,000/3.2%)
Michael Saylor was the face of the Bitcoin movement in 2024. His strategy of issuing equity and convertible debt catapulted MicroStrategy’s market cap from $10 billion at the beginning of the year to $65 at the end. At one point in November, it got as high as $106 billion.​
And so naturally in today’s degen investing world, it received the 2x ETF treatment. And investors piled in.​
I’m afraid this is going to end badly. I guess it already is. One of these products, MSTX, is already in a 78% drawdown. “Gee Michael, how brave of you.”​
I started this post weeks ago before it started to freefall, I double pinkie promise. Anyway, this is not the decline I was looking for. I’ll explain more in a minute.​
Victor Haghani was quoted in the WSJ “We estimate the probability of the leveraged MicroStrategy ETFs going bust in the next year at between 20% to 50%,” said Victor Haghani, who runs the investment firm Elm Wealth.​
In the same article, Dave Mazza said: “These two firms have created something that it is now clear the market can’t handle,” said Dave Mazza, CEO of competitor Roundhill Investments. “It’s really a risk to do this with options. You can’t control the market.”​
Okay, so, when I say that these levered ETFs would blow up, I wasn’t making a call on MicroStrategy itself. In fact, I was thinking its continued success would lead to its downfall. I thought, because of the size and funky nature of this structure, that it would get so big that something underneath the hood would crack and these things would nose dive 80% in a day.​
Now that it’s down almost 80% (the 2x), I think the odds of a catastrophic one-day meltdown have decreased substantially. When I started writing this a few weeks ago I had this at 22% chance. Now I think it’s down to 3%.​
I’m almost embarrassed to say that I’m tempted to buy this dip, but I’m not going to, which means that I probably should (definitely not investment gambling advice).​
VIX spikes to 50 (+145/41%)
It’s not very bold to think that there will be a VIX spike at some point this year. Happens every year right? Wrong! I was surprised to see the average maximum VIX level by calendar year is 39.​
Three of the last four years have seen a max VIX spike of under 40. I think that ends this year. What causes it? Your guess is as good as mine.​
The worst performers in 24 will be the best in 25 (+400/20%)
Bespoke tweeted a crazy stat today that pairs very nicely with this prediction: The 10 worst performers in 2023 were all down again in 2024. That’s pretty wild when you consider that the index was up more than 20% each year.​
I think that changes in 2025 and I am betting on it. I’m long DLTR and MRNA, two absolute dogs. Not that you asked, but to be fully transparent, MRNA is pure speculation and the position is sized for that. If it rolls again, I’m out. I’m giving DLTR a longer leash.​
I 20% think some of the 10 worst performers of the last two years will be on the top 10 list this year.​
Momentum keeps going in the first half, but we have a double-digit correction in the back half and end down on the year. (+10,000/1%)
There is a high degree of difficulty on this one. Parlays usually don’t work. The market is down one out of four years, so 25% is my baseline for the latter part of this prediction.​
64% of all years have seen a double-digit decline, as you can see in the chart below.​
How many times has the market been up double digits through June and ended down on the year? Only once, in 1928. This surprised me too, thought there would have been a few more years on the list. So, yeah, 100-to-1 odds on this one. Any takers?​
Bonus. Something comes out of nowhere that makes at least half of these predictions look very dumb. (-1000/90%)
Ben Graham once said, “Nearly everyone interested in common stocks wants to be told by someone else what he thinks the market is going to do. The demand being there, it must be supplied.”​
Predictions are impossible. Everyone knows this, I hope.​
If you reframed the question “What do you think the market will do next year?” to “Do you think you can predict the future,” then maybe it would become more apparent how silly all of this is. Of course, nobody can predict the future. Of course, nobody knows what the market is going to do next year.​
I encourage everyone to make a list like this. It will serve as a reminder twelve months from now about how wrong you were about so many things, and hopefully, that will encourage you not to invest in a way that counts on you getting the next twelve months right.​


So my list.

1. Gold to continue its bull market, driven by BRICS use of gold as the reserve asset. Outlier: US revalues their gold to reduce debt. Every $4000/oz = $1 Trillion. So a revaluation to $12,000/oz.

2. Conversely, Trump tries the above, except unilaterally with BTC, making BTC a US reserve asset.

3. If Trump does not try to monetise BTC, then BTC price enters a bear market and MSTR blows up.

4. The $7 Trillion in debt rollovers + $2 Trillion trade deficit + continued deficit spending creates a Treasury market melt-down. The Federal Reserve is forced to intervene and return to outright QE, expanding their balance sheet. This does lead to higher inflation this time.

5. Trump unleashes Musk and DOGE. This is the Argentina playbook, ie austerity. Musk implements his DOGE before devaluing the debt (debt/gdp) and creates a sh*t storm because the USD will move higher, much higher and because foreigners were not short $13T in peso-denominated debt; they are short $13T of USD-denominated debt. Foreigners were not long $57T in peso-denominated assets, including $8.5T in Argentine government bonds; foreigners are long $57T in USD-denominated assets, including $8.5T in USTs. When the Argentine peso strengthened as a result of Milei’s austerity, foreigners did not sell peso-denominated stocks and bonds; foreigners will sell USD assets and USTs aggressively if the US implements Milei-like austerity, sending US stock prices down and UST yields up (to obtain USD) paradoxically leading to a blowout in the US fiscal deficit as a result of austerity.

6. IF US stocks fall, US deficits will explode higher as US stock market performance (higher) = tax revenue. Falling stock prices = falling tax revenues.

7. Trump surrenders Ukraine to Putin.

8. USD devalues. Much like FDR in 1933, Nixon in 1971, Trump in 2025 devalues USD by 30%.

9. This devaluation causes a bullish surge in stock prices, gold and btc if it's still in existence.

10. Duc's new strategy returns 20% on capital/month and I retire from the day job to play the market all day.

jog on
duc
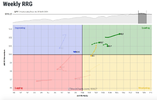
I like number #10😀
 
Top