You are using an out of date browser. It may not display this or other websites correctly.
You should upgrade or use an alternative browser.
You should upgrade or use an alternative browser.
Gold Price - Where is it heading?
- Thread starter guycharles
- Start date
-
- Tags
- gold gold price
- Joined
- 13 February 2006
- Posts
- 5,264
- Reactions
- 12,116
Good morning gold lovers,
Just had an opportunity for a looksie at some World Gold Council data on jewellery, with the PoG the effect on jewellery demand. Demand is gold (pardon the pun)... Be much clearer with data to 30 June 2024. But anyways:
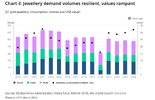
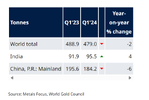
 www.gold.org
Have a very nice Sunday.
Kind regards
rcw1
Just had an opportunity for a looksie at some World Gold Council data on jewellery, with the PoG the effect on jewellery demand. Demand is gold (pardon the pun)... Be much clearer with data to 30 June 2024. But anyways:

- First quarter gold jewellery consumption of 479t was 2% softer y/y - Good ol India holding up the data with several star pickets !! Interesting.

Jewellery
Have a very nice Sunday.
Kind regards
rcw1
- Joined
- 13 February 2006
- Posts
- 5,264
- Reactions
- 12,116
From Jim Rickards:
|
|
|
|
|
- Joined
- 16 April 2024
- Posts
- 19
- Reactions
- 30
It would be interesting to know how much gold he has, or bought recently.From Jim Rickards:
RICKARDS
I’ve previously said that gold could reach $15,000 by 2026. Today, I’m updating that forecast.
My latest forecast is that gold may actually exceed $27,000.
I don’t say that to get attention or to shock people. It’s not a guess; it’s the result of rigorous analysis.
Of course, there’s no guarantee it’ll happen. But this forecast is based on the best available tools and models that have proved accurate in many other contexts.
Here’s how I reached that price level forecast…
This analysis begins with a simple question: What’s the implied non-deflationary price of gold under a new gold standard?
No central banker in the world wants a gold standard. Why would they? Right now, they control the machinery of global currencies (also called fiat money).
They have no interest in a form of money they can’t control. It took about 60 years from 1914–1974 to drive gold out of the monetary system. No central banker wants to let it back in.
Still, what if they have no choice? What if confidence in command currencies collapses due to some combination of excessive money creation, competition from Bitcoin, extreme levels of dollar debt, a new financial crisis, war or natural disaster?
In that case, central bankers may return to gold not because they want to, but because they must in order to restore order to the global monetary system.
What’s the Proper Gold Price?
That scenario begs the question: What is the new dollar price of gold in a system in which dollars are freely exchangeable for gold at a fixed price?
If the dollar price is too high, investors will sell gold for dollars and spend freely. Central banks will have to increase the money supply to maintain equilibrium. That’s an inflationary result.
If the dollar price is too low, investors will line up to redeem dollars for gold and then hoard the gold. Central banks will have to reduce the money supply to maintain equilibrium. That reduces velocity and is deflationary.
Something like the latter case happened in the U.K. in 1925 when it returned to a gold standard at an unrealistically low price. The result was that the U.K. entered the Great Depression several years ahead of other developed economies.
Something like the former case happened in the U.S. in 1933, when FDR devalued the dollar against gold. Citizens weren’t allowed to own gold, so there was no mass redemption of gold. But other commodity prices rose sharply.
That was the point of the devaluation. Resulting inflation helped lift the U.S. out of deflation and gave the economy a boost from 1933–1936 in the midst of the Great Depression. (The Fed caused another severe recession in 1937–1938 with their customary incompetence.)
The policy goal obviously is to get the price “just right” by maintaining the proper equilibrium between gold and dollars. The U.S. is in an ideal position to do this by selling gold from U.S. Treasury reserves, about 8,100 metric tonnes (261.5 million troy ounces), or buying gold in the open market using freshly printed Fed money.
The goal would be to maintain the dollar price of gold in a narrow range around the fixed price.
What price is just right? This question is easy to answer, subject to a few assumptions.
U.S. M1 money supply is $17.9 trillion. (I use M1, which is a good proxy for everyday money).
What is M1? This is the supply that is the most liquid and money that is the easiest to turn into cash.
It contains actual cash (bills and coins), bank reserves (what’s actually kept in the vaults) and demand deposits (money in your checking account that can be turned into cash easily).
One needs to make an assumption about the percentage of gold backing for the money supply needed to maintain confidence. I assume 40% coverage with gold. (This was the legal requirement for the Fed from 1913–1946. Later it was 25%, then zero today).
Applying the 40% ratio to the $17.9 trillion money supply means that $7.2 trillion of gold is required.
Applying the $7.2 trillion valuation to 261.5 million troy ounces yields a gold price of $27,533 per ounce.
That’s the implied non-deflationary equilibrium price of gold in a new global gold standard. Of course, money supplies fluctuate; lately they’ve been going up sharply, especially in the U.S.
There’s room for debate about whether a 40% backing ratio is too high or too low. Still, my assumptions are moderate based on monetary economics and history. A dollar price of gold of over $25,000 per ounce in a new gold standard is not a stretch.
Obviously, you get around $12,500 per ounce if you assume 20% coverage. There are many variables in play.
The Fundamental Model
This model is also straightforward. It relies on factors we learned about in our first week of Intro to Economics — supply and demand.
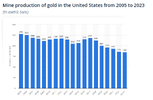
The most significant development on the supply side is the decrease of new mining output. As the chart shows below, mine production of gold in the U.S. has been decreasing steadily since 2017.
That’s not to argue that the world has reached “peak gold,” (output could expand in future for a variety of reasons). Still, my contacts in the mining community consistently report that gold is becoming more difficult to source and the quality of newly discovered ore is low-to-medium at best.
Flat output, all things equal, tends to put a floor under prices and to support higher prices based on other factors.
The Demand Side
The demand side is driven largely by central banks, ETFs, hedge funds and individual purchases. Traditional institutional investors are not large investors in gold. Much of the demand from hedge funds is conducted in derivatives such as gold futures.
Derivatives generally don’t involve physical delivery of gold. They involve “paper gold” that far exceeds the actual, physical gold supply. It’s this paper gold market that accounts for volatility in the gold market, not gold itself.
That puts central bank gold demand on track for a new record. There’s no sign of that demand slowing in 2024.
Overall, the picture is one of flat supply and increasing demand, mostly in the form of official purchases by central banks.
A Math Lesson
Finally, a bit of elementary math is helpful in understanding how the dollar price of gold can move past $25,000 per ounce in the next two years. For this purpose, we’ll assume a baseline price of $2,000 per ounce (although gold has been in the $2,300 range lately with no signs of falling back to the $2,000 level).
But for our purposes, we’ll keep it simple.
A move from $2,000 per ounce to $3,000 per ounce is a heavy lift. That’s a 50% increase and could easily take a year or more. Beyond that, a further increase from $3,000 to $4,000 is a 33% increase: another large rally. A further gain from $4,000 per ounce to $5,000 per ounce is a further gain of 25%.
But notice the pattern. Each gain is $1,000 per ounce, but the percentage increase drops from 50% to 33% to 25%. That’s because the starting point is higher while the $1,000 gain is constant. Each $1,000 jump represents a smaller (and easier) percentage gain than the one before.
This pattern continues. Moving from $9,000 per ounce to $10,000 per ounce is only an 11% gain. Moving from $14,000 per ounce to $15,000 per ounce is only a 7% gain. Gold can move 1% in a single trading day, sometimes 2% or more.
As an extreme example, a move from $99,000 per ounce to $100,000 per ounce is about a 1% move. Those $1,000 pops get even easier as we approach my calculated gold price of $27,533.
The lesson for you as an investor is to buy gold now.
As prices continue to rally, you’ll get more gold for your money at the outset and high-percentage returns as gold rallies from a lower base. Toward the end of the long march past $25,000 per ounce, you’ll have bigger dollar gains because you started with more gold.
Others will jump on the bandwagon, but you’ll already have a comfortable seat.
Regards,
Jim Rickards
for The Daily Reckoning
jog on
duc
- Joined
- 25 July 2021
- Posts
- 875
- Reactions
- 2,215
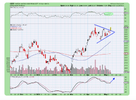
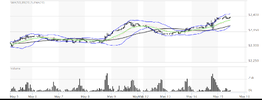
Some nearby targets for GLD ETF.
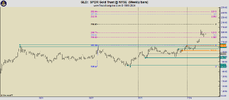
I traded the move up to this price zone and now I'm looking to get back in. my options to buy are (1) just buy now while the price is between the two trend lines, (2) buy at the next higher low between the trend lines, (3) buy as the price breaks the upper trend line.
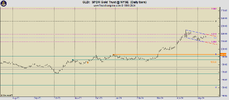
After reading the above post from @ducati916 I feel spoilt for chose.

Garpal Gumnut
Ross Island Hotel
- Joined
- 2 January 2006
- Posts
- 13,773
- Reactions
- 10,531
Thanks @DaveTrade . The TA is quite definitely bullish on Gold/Oz. To my eyes a target of $USD 3000 by Northern Spring 2025 with a possible retracement to $USD 2000 any time before then in line with volatility on the NYSE's, interest rates and inflation. There will be resistance at the centennial marks on the way through and major support just above and just below $USD 2000.
Who knows where the Palestinian, Zionist, US Christian and Persian cousins will take us in the meantime. I always feel more comfortable with atheists in charge of WMD rather than any believer in the end of times or the convenor of a meeting of the clans in the hereafter. The imminent disposal of BTC, should the markets implode, will again leave Gold as the asset of last resort.
Up until this year I did have some trading bets on Gold, but from now on will be adding to my store probably via smaller accumulative bets on PMGOLD with no intention of selling. Two reasons for this, it is quite stressful because of the large bet trading, and secondly I am convinced that Gold will continue to appreciate such that selling on retracements will lose to the ultimate profit of being a long term holder.
As the Bronze Loon said, "It is what it is".
gg
- Joined
- 25 July 2021
- Posts
- 875
- Reactions
- 2,215
In view of the current situation in the world, new standard of gold backed currencies, a case for the continuation of inflation for a number of years causing sector rebalancing. Buy and hold in the gold market has never been a better choice.from now on will be adding to my store probably via smaller accumulative bets on PMGOLD with no intention of selling
- Joined
- 8 June 2008
- Posts
- 13,229
- Reactions
- 19,520
I am a qld but please no XXXX LOL..quGood afternoon
Gold continues to impress, improving on the threshold of value overall and bouncing into zones that will be become second nature before too long.
No sell by rcw1. Yellow (physical) is gold
Go Queensland women in SoO 1 tonight. The place is abounded in maroon... XXXX on the menu.
View attachment 176966
Gold is giving us plenty to celebrate..when will be time to sell next.....
- Joined
- 19 October 2005
- Posts
- 4,691
- Reactions
- 6,969
It's all poison I'm afraid. I'd love a beer(s)I am a qld but please no XXXX LOL..
Hey mate, yes that is a very good question... gunna sit back and enjoy the ride and see what eventuates, with yellow got long time. The question more so for rcw1 is when to buy more bloke??I am a qld but please no XXXX LOL..
Gold is giving us plenty to celebrate..when will be time to sell next.....
Have a very nice night qldfrog... working up that glow... going to be a mature rcw1 and get on the rum soon ha ha ha ha ha; oh the joy at the thought.
Tutt ta
Kind regards
rcw1
don't know how they made it so cheap ... beer that is... hope they got enough tonight ha ha ha haIt's all poison I'm afraid. I'd love a beer(s)
- Joined
- 8 June 2008
- Posts
- 13,229
- Reactions
- 19,520
I agree a beer.not XXXXIt's all poison I'm afraid. I'd love a beer(s)
Ok, I stop with my out of topic garbage...
Garpal Gumnut
Ross Island Hotel
- Joined
- 2 January 2006
- Posts
- 13,773
- Reactions
- 10,531
You will never stop your off topic garbage.I agree a beer.not XXXX
Ok, I stop with my out of topic garbage...
You cannot help yourself.
gg
Garpal Gumnut
Ross Island Hotel
- Joined
- 2 January 2006
- Posts
- 13,773
- Reactions
- 10,531
I did read on Kitco.com today that Chinese retail buyers had cut back on their buying of Gold because of impecunity. Just goes to show that if you don't have money Gold is not as important as shelter, food and drink.
Everyone else seems to continue buying, though. On with the dance.
gg
Everyone else seems to continue buying, though. On with the dance.
gg
Garpal Gumnut
Ross Island Hotel
- Joined
- 2 January 2006
- Posts
- 13,773
- Reactions
- 10,531
For anyone new to Gold this is a good short recent summary from the Gold Council on moves over the last 2 months.
Gold appreciated 4% on buying from Central Banks. The Indian cousins still buying retail.
gg
Gold appreciated 4% on buying from Central Banks. The Indian cousins still buying retail.
gg
- Joined
- 13 February 2006
- Posts
- 5,264
- Reactions
- 12,116
Nothing that this thread is unaware of:
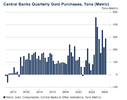
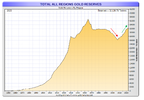
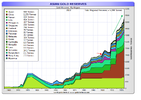
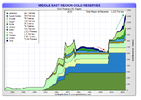
Gold moving East.
OPEC+ moving away from UST as the Reserve Asset to Gold as the Reserve Asset.
With the oil market now x13 as large as the gold market, still a target of +/- $31,000.
Rickards had a similar price by a different calculation.
The number seems too big. Not when you consider that the price has been suppressed for 50yrs by UST accumulation. This is now unwinding at an accelerating rate.
jog on
duc
- Joined
- 21 November 2022
- Posts
- 389
- Reactions
- 989
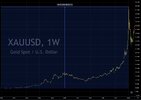
Its not that crazy when you actually see that type of % gain has precedentWith the oil market now x13 as large as the gold market, still a target of +/- $31,000.
Rickards had a similar price by a different calculation.
The number seems too big. Not when you consider that the price has been suppressed for 50yrs by UST accumulation. This is now unwinding at an accelerating rate.
jog on
duc
Similar threads
- Replies
- 1
- Views
- 527
- Replies
- 171
- Views
- 10K
- Replies
- 7
- Views
- 2K

