You are using an out of date browser. It may not display this or other websites correctly.
You should upgrade or use an alternative browser.
You should upgrade or use an alternative browser.
Gold Price - Where is it heading?
- Thread starter guycharles
- Start date
-
- Tags
- gold gold price
- Joined
- 24 July 2021
- Posts
- 144
- Reactions
- 421
Isn’t Peter Schiff always predicting the worst will happen though ?.
Everytime the stockmarket looks shaky, people like him seem to come out of the woodwork and predict doom and gloom.
Everytime the stockmarket looks shaky, people like him seem to come out of the woodwork and predict doom and gloom.
Sean K
Moderator
- Joined
- 21 April 2006
- Posts
- 22,363
- Reactions
- 11,724
Isn’t Peter Schiff always predicting the worst will happen though ?.
Everytime the stockmarket looks shaky, people like him seem to come out of the woodwork and predict doom and gloom.
Yes, he's predicted 1000 of the last 1 crashes.
- Joined
- 20 July 2021
- Posts
- 11,850
- Reactions
- 16,518
well if my books looked like the Feds , i would probably hang myselfIsn’t Peter Schiff always predicting the worst will happen though ?.
Everytime the stockmarket looks shaky, people like him seem to come out of the woodwork and predict doom and gloom.
also certain BRICS nations have been buying physical ( and not in US dollars )
Sean K
Moderator
- Joined
- 21 April 2006
- Posts
- 22,363
- Reactions
- 11,724
- Joined
- 13 February 2006
- Posts
- 5,263
- Reactions
- 12,113
- Joined
- 8 June 2008
- Posts
- 13,226
- Reactions
- 19,513
The guys are in weekend, wait for tomorrow
Sean K
Moderator
- Joined
- 21 April 2006
- Posts
- 22,363
- Reactions
- 11,724
The guys are in weekend, wait for tomorrow
Gotta be some profit taking soon, shirley...
- Joined
- 12 January 2008
- Posts
- 7,363
- Reactions
- 18,406
Gold, silver, copper, uranium ETFs all opening gap up this evening (US morning).
Garpal Gumnut
Ross Island Hotel
- Joined
- 2 January 2006
- Posts
- 13,769
- Reactions
- 10,527
Gold appears to have some momentum at evening's close in NY.
$USD 2448.90
gg
$USD 2448.90
gg
Bailxtrader
Australian Republic Today
- Joined
- 30 January 2024
- Posts
- 155
- Reactions
- 288
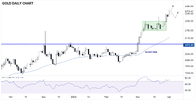
- Gold is seeing a notable rally to record highs despite otherwise quiet trading conditions.
- Expectations of a Fed rate cut this quarter are supporting the bullion.
- XAU/USD’s technical outlook remains bullish above previous-resistance-turned-support near $2200.
Source: TradingView, StoneX
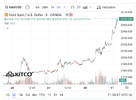
Turning our attention to the chart, Gold has clearly broken out of March’s 3-week sideways range between $2150 and $2200, hinting at the potential for another leg higher from here. For now, the near-term bullish momentum will remain the dominant feature of the chart as long as prices hold above previous-resistance-turned-support at $2200, and with prices already at record highs, there’s little in the way of meaningful resistance until above $2300.
Garpal Gumnut
Ross Island Hotel
- Joined
- 2 January 2006
- Posts
- 13,769
- Reactions
- 10,527
With most of Europe still out of the office for the long Easter holiday, markets are playing an April Fool’s Day trick on any traders expecting volatility today.
- Gold is seeing a notable rally to record highs despite otherwise quiet trading conditions.
- Expectations of a Fed rate cut this quarter are supporting the bullion.
- XAU/USD’s technical outlook remains bullish above previous-resistance-turned-support near $2200.
View attachment 173874
Source: TradingView, StoneX
Turning our attention to the chart, Gold has clearly broken out of March’s 3-week sideways range between $2150 and $2200, hinting at the potential for another leg higher from here. For now, the near-term bullish momentum will remain the dominant feature of the chart as long as prices hold above previous-resistance-turned-support at $2200, and with prices already at record highs, there’s little in the way of meaningful resistance until above $2300.
Thanks for the chart @Bailxtrader
Should this bull run continue this week I can see from TA, juggling the range values from $USD2000.00, that $2500.00 is achievable soon. If so that will be a 25% gain in 1 mo., and not to be sneezed at.
I believe the Israeli and Persian cousins are upping the ante in the Middle East. Two probable knuckler powers going at each other should give gold some fundamental steam.
gg
- Joined
- 28 May 2020
- Posts
- 6,702
- Reactions
- 12,870
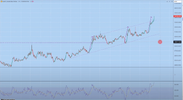
Well I got that one wrong didn't I.From BTL ,
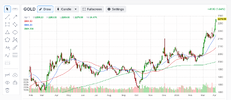
The Chartists among us will be able to interpret this far better than I can.
But if I was pretending to be one, I might suggest that a pull back is on the cards to replicate the last two times it popped close to the top of that channel.
mick
View attachment 173398
Mick
Sean K
Moderator
- Joined
- 21 April 2006
- Posts
- 22,363
- Reactions
- 11,724
Well, BtL got it wrong.
- Joined
- 13 February 2006
- Posts
- 5,263
- Reactions
- 12,113
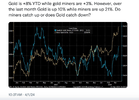
While physical is currently being driven higher by its adoption as an oil currency, miners are more the recipients of the inflation trade.
Equity markets are 'starting' to view good news as bad news. Good news tends to delay the need for rate cuts (that seems to be the psychology currently) which of course may actually turn out to be a really bad thing for equities anyway.
Miners catch up.
jog on
duc
- Joined
- 13 February 2006
- Posts
- 5,263
- Reactions
- 12,113
greggles
I'll be back!
- Joined
- 28 July 2004
- Posts
- 4,494
- Reactions
- 4,598
View attachment 173906
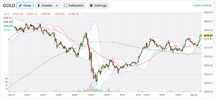
The selling started at 4am NY time and continued through the open. Couldn't hold it down.
jog on
duc
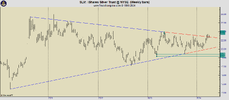
I have been watching silver trade and it also feels like this at the moment. There are waves of selling that drive the price down but there is a strong undercurrent of buying pressure that starts to build take hold as soon as the price dips far enough. This buying pressure feels very strong, like a rising tide, much stronger than the selling, which feels like profit taking combined with a very weak attempt to keep a lid on the price.
- Joined
- 25 July 2021
- Posts
- 875
- Reactions
- 2,215
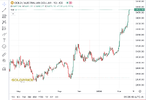
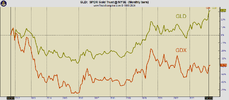
A big picture starting from the Sep 2011 top.View attachment 173898
While physical is currently being driven higher by its adoption as an oil currency, miners are more the recipients of the inflation trade.
Equity markets are 'starting' to view good news as bad news. Good news tends to delay the need for rate cuts (that seems to be the psychology currently) which of course may actually turn out to be a really bad thing for equities anyway.
Miners catch up.
jog on
duc
- Joined
- 25 July 2021
- Posts
- 875
- Reactions
- 2,215
A chart of SLV with some support & resistance lines, I agree it's looking bullish and ready to break out to the upside.I have been watching silver trade and it also feels like this at the moment. There are waves of selling that drive the price down but there is a strong undercurrent of buying pressure that starts to build take hold as soon as the price dips far enough. This buying pressure feels very strong, like a rising tide, much stronger than the selling, which feels like profit taking combined with a very weak attempt to keep a lid on the price.
Sean K
Moderator
- Joined
- 21 April 2006
- Posts
- 22,363
- Reactions
- 11,724
Similar threads
- Replies
- 1
- Views
- 519
- Replies
- 171
- Views
- 10K
- Replies
- 7
- Views
- 2K

